Expected Loss Covered Bond Model
Expected Loss Covered Bond Model
Expected Loss Covered Bond Model

You also want an ePaper? Increase the reach of your titles
YUMPU automatically turns print PDFs into web optimized ePapers that Google loves.
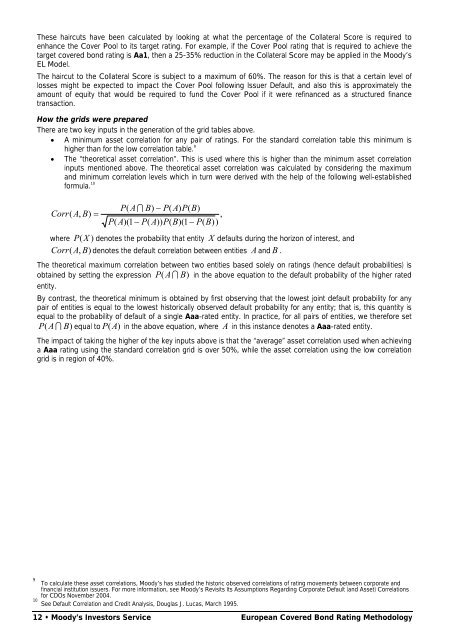
These haircuts have been calculated by looking at what the percentage of the Collateral Score is required to<br />
enhance the Cover Pool to its target rating. For example, if the Cover Pool rating that is required to achieve the<br />
target covered bond rating is Aa1, then a 25-35% reduction in the Collateral Score may be applied in the Moody’s<br />
EL <strong>Model</strong>.<br />
The haircut to the Collateral Score is subject to a maximum of 60%. The reason for this is that a certain level of<br />
losses might be expected to impact the Cover Pool following Issuer Default, and also this is approximately the<br />
amount of equity that would be required to fund the Cover Pool if it were refinanced as a structured finance<br />
transaction.<br />
How the grids were prepared<br />
There are two key inputs in the generation of the grid tables above.<br />
• A minimum asset correlation for any pair of ratings. For the standard correlation table this minimum is<br />
higher than for the low correlation table. 9<br />
• The “theoretical asset correlation”. This is used where this is higher than the minimum asset correlation<br />
inputs mentioned above. The theoretical asset correlation was calculated by considering the maximum<br />
and minimum correlation levels which in turn were derived with the help of the following well-established<br />
formula. 10 P(<br />
A I B)<br />
− P(<br />
A)<br />
P(<br />
B)<br />
Corr(<br />
A,<br />
B)<br />
=<br />
,<br />
P(<br />
A)(1<br />
− P(<br />
A))<br />
P(<br />
B)(1<br />
− P(<br />
B))<br />
where P(X<br />
) denotes the probability that entity X defaults during the horizon of interest, and<br />
Corr( A,<br />
B)<br />
denotes the default correlation between entities A and B .<br />
The theoretical maximum correlation between two entities based solely on ratings (hence default probabilities) is<br />
obtained by setting the expression P( A I B)<br />
in the above equation to the default probability of the higher rated<br />
entity.<br />
By contrast, the theoretical minimum is obtained by first observing that the lowest joint default probability for any<br />
pair of entities is equal to the lowest historically observed default probability for any entity; that is, this quantity is<br />
equal to the probability of default of a single Aaa-rated entity. In practice, for all pairs of entities, we therefore set<br />
P( A I B) equal to P (A)<br />
in the above equation, where A in this instance denotes a Aaa-rated entity.<br />
The impact of taking the higher of the key inputs above is that the “average” asset correlation used when achieving<br />
a Aaa rating using the standard correlation grid is over 50%, while the asset correlation using the low correlation<br />
grid is in region of 40%.<br />
9<br />
To calculate these asset correlations, Moody’s has studied the historic observed correlations of rating movements between corporate and<br />
financial institution issuers. For more information, see Moody’s Revisits Its Assumptions Regarding Corporate Default (and Asset) Correlations<br />
for CDOs November 2004.<br />
10<br />
See Default Correlation and Credit Analysis, Douglas J. Lucas, March 1995.<br />
12 • Moody’s Investors Service European <strong>Covered</strong> <strong>Bond</strong> Rating Methodology