ideas about measurement in terms of point and set paradigms
ideas about measurement in terms of point and set paradigms
ideas about measurement in terms of point and set paradigms

Create successful ePaper yourself
Turn your PDF publications into a flip-book with our unique Google optimized e-Paper software.
4 A. BUFFLER ET AL.<br />
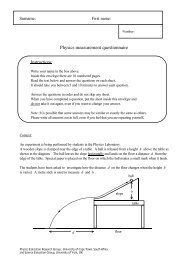
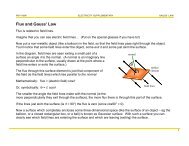
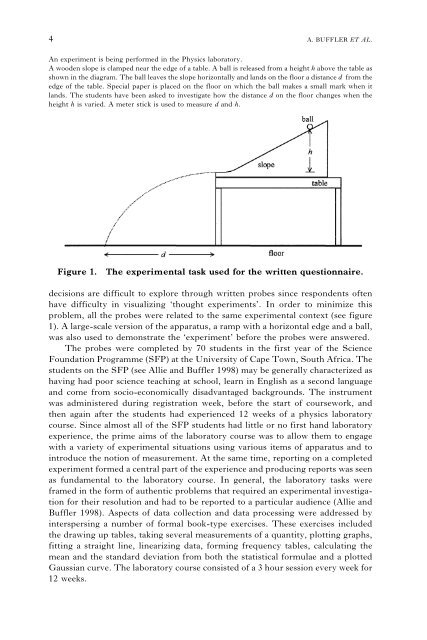
An experiment is be<strong>in</strong>g performed <strong>in</strong> the Physics laboratory.<br />
A wooden slope is clamped near the edge <strong>of</strong> a table. A ball is released from a height h above the table as<br />
shown <strong>in</strong> the diagram. The ball leaves the slope horizontally <strong>and</strong> l<strong>and</strong>s on the floor a distance d from the<br />
edge <strong>of</strong> the table. Special paper is placed on the floor on which the ball makes a small mark when it<br />
l<strong>and</strong>s. The students have been asked to <strong>in</strong>vestigate how the distance d on the floor changes when the<br />
height h is varied. A meter stick is used to measure d <strong>and</strong> h.<br />
Figure 1.<br />
The experimental task used for the written questionnaire.<br />
decisions are difficult to explore through written probes s<strong>in</strong>ce respondents <strong>of</strong>ten<br />
have difficulty <strong>in</strong> visualiz<strong>in</strong>g ‘thought experiments’. In order to m<strong>in</strong>imize this<br />
problem, all the probes were related to the same experimental context (see figure<br />
1). A large-scale version <strong>of</strong> the apparatus, a ramp with a horizontal edge <strong>and</strong> a ball,<br />
was also used to demonstrate the ‘experiment’ before the probes were answered.<br />
The probes were completed by 70 students <strong>in</strong> the first year <strong>of</strong> the Science<br />
Foundation Programme (SFP) at the University <strong>of</strong> Cape Town, South Africa. The<br />
students on the SFP (see Allie <strong>and</strong> Buffler 1998) may be generally characterized as<br />
hav<strong>in</strong>g had poor science teach<strong>in</strong>g at school, learn <strong>in</strong> English as a second language<br />
<strong>and</strong> come from socio-economically disadvantaged backgrounds. The <strong>in</strong>strument<br />
was adm<strong>in</strong>istered dur<strong>in</strong>g registration week, before the start <strong>of</strong> coursework, <strong>and</strong><br />
then aga<strong>in</strong> after the students had experienced 12 weeks <strong>of</strong> a physics laboratory<br />
course. S<strong>in</strong>ce almost all <strong>of</strong> the SFP students had little or no first h<strong>and</strong> laboratory<br />
experience, the prime aims <strong>of</strong> the laboratory course was to allow them to engage<br />
with a variety <strong>of</strong> experimental situations us<strong>in</strong>g various items <strong>of</strong> apparatus <strong>and</strong> to<br />
<strong>in</strong>troduce the notion <strong>of</strong> <strong>measurement</strong>. At the same time, report<strong>in</strong>g on a completed<br />
experiment formed a central part <strong>of</strong> the experience <strong>and</strong> produc<strong>in</strong>g reports was seen<br />
as fundamental to the laboratory course. In general, the laboratory tasks were<br />
framed <strong>in</strong> the form <strong>of</strong> authentic problems that required an experimental <strong>in</strong>vestigation<br />
for their resolution <strong>and</strong> had to be reported to a particular audience (Allie <strong>and</strong><br />
Buffler 1998). Aspects <strong>of</strong> data collection <strong>and</strong> data process<strong>in</strong>g were addressed by<br />
<strong>in</strong>terspers<strong>in</strong>g a number <strong>of</strong> formal book-type exercises. These exercises <strong>in</strong>cluded<br />
the draw<strong>in</strong>g up tables, tak<strong>in</strong>g several <strong>measurement</strong>s <strong>of</strong> a quantity, plott<strong>in</strong>g graphs,<br />
fitt<strong>in</strong>g a straight l<strong>in</strong>e, l<strong>in</strong>eariz<strong>in</strong>g data, form<strong>in</strong>g frequency tables, calculat<strong>in</strong>g the<br />
mean <strong>and</strong> the st<strong>and</strong>ard deviation from both the statistical formulae <strong>and</strong> a plotted<br />
Gaussian curve. The laboratory course consisted <strong>of</strong> a 3 hour session every week for<br />
12 weeks.