Modeling Climate Policy Instruments in a Stackelberg Game with ...
Modeling Climate Policy Instruments in a Stackelberg Game with ...
Modeling Climate Policy Instruments in a Stackelberg Game with ...

You also want an ePaper? Increase the reach of your titles
YUMPU automatically turns print PDFs into web optimized ePapers that Google loves.
4.4 Technology <strong>Policy</strong> 77<br />
no tax m e2 m k m ky m ky e2<br />
welfare 6.68 6.68 7.79 8.21 8.21<br />
consumption 9.63 9.63 20.62 21.67 21.67<br />
output 9.88 9.88 30.91 33.48 33.49<br />
labor 0.11 0.11 7.14 7.21 7.21<br />
total capital 8.03 8.03 72.40 81.84 81.85<br />
energy 6.67 6.67 47.11 22.78 22.80<br />
resources 5.36 5.33 42.05 20.80 20.80<br />
rents (resource sector) 19.51 19.43 183.55 84.99 84.75<br />
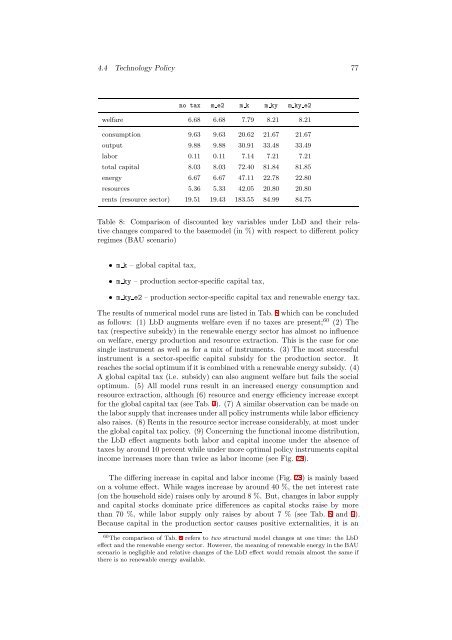
Table 8: Comparison of discounted key variables under LbD and their relative<br />
changes compared to the basemodel (<strong>in</strong> %) <strong>with</strong> respect to different policy<br />
regimes (BAU scenario)<br />
m k – global capital tax,<br />
m ky – production sector-specific capital tax,<br />
m ky e2 – production sector-specific capital tax and renewable energy tax.<br />
The results of numerical model runs are listed <strong>in</strong> Tab. 8 which can be concluded<br />
as follows: (1) LbD augments welfare even if no taxes are present; 60 (2) The<br />
tax (respective subsidy) <strong>in</strong> the renewable energy sector has almost no <strong>in</strong>fluence<br />
on welfare, energy production and resource extraction. This is the case for one<br />
s<strong>in</strong>gle <strong>in</strong>strument as well as for a mix of <strong>in</strong>struments. (3) The most successful<br />
<strong>in</strong>strument is a sector-specific capital subsidy for the production sector. It<br />
reaches the social optimum if it is comb<strong>in</strong>ed <strong>with</strong> a renewable energy subsidy. (4)<br />
A global capital tax (i.e. subsidy) can also augment welfare but fails the social<br />
optimum. (5) All model runs result <strong>in</strong> an <strong>in</strong>creased energy consumption and<br />
resource extraction, although (6) resource and energy efficiency <strong>in</strong>crease except<br />
for the global capital tax (see Tab. 9). (7) A similar observation can be made on<br />
the labor supply that <strong>in</strong>creases under all policy <strong>in</strong>struments while labor efficiency<br />
also raises. (8) Rents <strong>in</strong> the resource sector <strong>in</strong>crease considerably, at most under<br />
the global capital tax policy. (9) Concern<strong>in</strong>g the functional <strong>in</strong>come distribution,<br />
the LbD effect augments both labor and capital <strong>in</strong>come under the absence of<br />
taxes by around 10 percent while under more optimal policy <strong>in</strong>struments capital<br />
<strong>in</strong>come <strong>in</strong>creases more than twice as labor <strong>in</strong>come (see Fig. 28).<br />
The differ<strong>in</strong>g <strong>in</strong>crease <strong>in</strong> capital and labor <strong>in</strong>come (Fig. 28) is ma<strong>in</strong>ly based<br />
on a volume effect. While wages <strong>in</strong>crease by around 40 %, the net <strong>in</strong>terest rate<br />
(on the household side) raises only by around 8 %. But, changes <strong>in</strong> labor supply<br />
and capital stocks dom<strong>in</strong>ate price differences as capital stocks raise by more<br />
than 70 %, while labor supply only raises by about 7 % (see Tab. 8 and 9).<br />
Because capital <strong>in</strong> the production sector causes positive externalities, it is an<br />
60 The comparison of Tab. 8 refers to two structural model changes at one time: the LbD<br />
effect and the renewable energy sector. However, the mean<strong>in</strong>g of renewable energy <strong>in</strong> the BAU<br />
scenario is negligible and relative changes of the LbD effect would rema<strong>in</strong> almost the same if<br />
there is no renewable energy available.