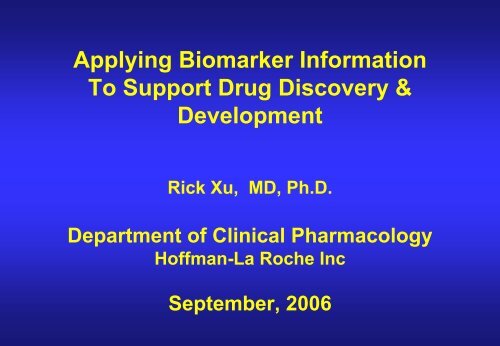
Applying Biomarker Information To Support Drug Discovery ... - IIR
Applying Biomarker Information To Support Drug Discovery ... - IIR
Applying Biomarker Information To Support Drug Discovery ... - IIR

You also want an ePaper? Increase the reach of your titles
YUMPU automatically turns print PDFs into web optimized ePapers that Google loves.
<strong>Applying</strong> <strong>Biomarker</strong> <strong>Information</strong><br />
<strong>To</strong> <strong>Support</strong> <strong>Drug</strong> <strong>Discovery</strong> &<br />
Development<br />
Rick Xu, MD, Ph.D.<br />
Department of Clinical Pharmacology<br />
Hoffman-La Roche Inc<br />
September, 2006
<strong>Biomarker</strong> & Clinical Endpoint<br />
<strong>Biomarker</strong>:<br />
A characteristic that is objectively<br />
measured & evaluated as an indicator of<br />
normal biologic, pathologic processes,<br />
or pharmacologic responses to a<br />
therapeutic intervention (NIH workshop)<br />
Values:<br />
• understand of mechanism of action<br />
• reduce the sample size and duration<br />
• less variable & reproducible<br />
• help trial design<br />
Challenges:<br />
Results may not be relevant or be able<br />
to predict clinical outcomes<br />
Clinical Endpoint:<br />
A characteristic or variable that<br />
reflects how a patient feels or<br />
functions, or how long a patient<br />
survives (NIH workshop)<br />
Values:<br />
• direct evidence to assess clinical<br />
outcomes<br />
Challenges:<br />
• cost<br />
• duration
Definition:<br />
Surrogate Endpoint<br />
A biomarker intended to substitute for a clinical endpoint. It is expected to<br />
predict clinical benefit, harm, or lack of benefit or harm (NIH work shop)<br />
Values:<br />
• understand of mechanism of action<br />
• reduce the sample size and duration<br />
• less variable & reproducible<br />
• be able to predict clinical outcomes<br />
Challenge:<br />
identify necessary evidence to establish a surrogate endpoint for a particular<br />
treatment clinical endpoint.<br />
Opportunity:<br />
put effort to investigate the high degree surrogacy information √
The Significance of High Degree<br />
Surrogacy <strong>Information</strong><br />
Predicted vs Observed Clin. Resp. with PEG-IFN (5KD)<br />
(data based upon 24 week treatment)<br />
ALT Normalization (%)<br />
150<br />
100<br />
50<br />
0<br />
Observation<br />
Prediction<br />
3M 6M 9M 3M 6M<br />
qw qw qw biw tiw<br />
Predicted Clin. Resp. (%)<br />
r 2 = 0.99<br />
p < 0.001<br />
Observed Clinical Response (%)
Develop a New Therapy<br />
• Strong Medical Needs<br />
> 200 million patients<br />
Lack of effective therapy (
PK/PD Criteria for a Target Molecule<br />
IFN 3MIU; tiw<br />
PEG 2-fold half-life<br />
Serum OAS (% of Baseline)<br />
PEG 5-fold half-life<br />
PEG 8-fold half-life<br />
0 800 0 800<br />
Time (hours)
PK Profiles of IFN / PEG-IFN in Rats<br />
1000000<br />
10000<br />
1000000<br />
IFN PEG 1<br />
10000<br />
100<br />
100<br />
Serum Conc. (U/ml)<br />
1<br />
0 6 12 18 24<br />
1000000<br />
*PEG-IFN<br />
10000<br />
100<br />
1<br />
0 10 20 30 40 50<br />
1000000<br />
1<br />
0 6 12 18 24<br />
1000000<br />
**PEG-IFN<br />
10000<br />
100<br />
1<br />
0 10 20 30 40 50<br />
1000000<br />
10000<br />
PEGSYS<br />
10000<br />
***PEG-IFN<br />
100<br />
100<br />
1<br />
0 6 12 18 24<br />
1<br />
0 6 12 18 24<br />
Time (hours)
Immunogenicity of PEG-IFN and IFN in Mice<br />
Antibody Titer a<br />
Treatment Median Range<br />
IFN (monomeric) 120 11 - 427<br />
IFN (aggregates) 2133 400 - 38,400<br />
PEG-IFN 0 0 - 57<br />
a<br />
using cell proliferation assay with 20-fold dilution
Comparison of Pharmacokinetic Profiles<br />
between PEG-IFN and IFN<br />
1000<br />
Serum Conc. (U/ml)<br />
100<br />
10<br />
IFN 3 MIU<br />
PEG-IFN 270 μg<br />
1<br />
0 50 100 150 200<br />
Time (hr)
Pharmacodynamic Response Increased Following<br />
PEG-IFN s.c. Administration<br />
1200<br />
Serum OAS (% of baseline)<br />
600<br />
0<br />
PEG2 135 mcg<br />
PEG2 45 mcg<br />
Rof. 3 MIU<br />
PEG2 270mcg<br />
Rof. 18 MIU<br />
0 50 100 150 200 250 300<br />
Time (hr)
Good Correlation between Predicted and<br />
Observed Trough OAS Level in Human<br />
OAS Trough Level ( % of Roferon 3 MIU)<br />
350<br />
300<br />
250<br />
200<br />
150<br />
100<br />
50<br />
0<br />
Rof 3miu<br />
PEG2 Predicted<br />
PEG2 Observed<br />
45 μg 135 μg 270 μg
D-E-AE Relationship Following S.C. Treatment<br />
In Healthy Subjects<br />
PD / Response Rate (%)<br />
100<br />
75<br />
50<br />
25<br />
0<br />
Phase I<br />
135 μg 180 μg<br />
G-III Neutropenia<br />
100<br />
75<br />
50<br />
25<br />
0<br />
Probability (%)<br />
0 100 200 300<br />
Dose (μg)
Good Correlation between Model Predicted and<br />
Clinically Observed Response Rate<br />
ALT or PCR Normalization (%)<br />
100<br />
75<br />
50<br />
25<br />
0<br />
Predicted<br />
Observed<br />
45 μg 90 μg 180 μg 270 μg
D-E-AE Relationship Following S.C. Treatment<br />
PD / Response Rate (%)<br />
100<br />
75<br />
50<br />
25<br />
0<br />
Phase I<br />
135 μg 180 μg<br />
100<br />
75<br />
Phase II<br />
180 μg<br />
135 μg<br />
50<br />
25<br />
ANC< 750<br />
G-III Neutropenia<br />
0<br />
0 100 200 300 0 100 200 300<br />
Dose (μg)<br />
Probability (%)
Good Correlation between Model Predicted &<br />
Clinically Observed Response Rate<br />
ALT or PCR Normalization (%)<br />
100<br />
75<br />
50<br />
25<br />
0<br />
Predicted<br />
Observed<br />
45 μg 90 μg 180 μg 270 μg
Significance of Critical Reasoning<br />
Effects of rolipram in aged mice<br />
• Improvement in spatial memory<br />
• Improvement in LTP is<br />
• Attenuation of impairment in spatial memory<br />
PKA signaling plays key role in memory process
Findings of PKA Signaling Pathway<br />
Pre-Clinical <strong>Information</strong><br />
• High potency in multiple animal<br />
models (all studies were done<br />
in rodents)<br />
• good or acceptable PK<br />
• good or defendable <strong>To</strong>x.<br />
package<br />
• No QT issues<br />
• Clean or defendable safety<br />
pharmacology<br />
Human Experiences<br />
• Peripheral indications ( +, ?)<br />
• biomarker<br />
• clinical endpoint<br />
• Central Effect indications (-, ?)<br />
• biomarker<br />
• clinical endpoint<br />
• manageable safety / tolerability<br />
• good or manageable PK
Anatomic Differences in Brain between Rodent & Primate<br />
NA: Nucleus accumbens<br />
(reward-motivated actions)<br />
Amyg: Amygdala<br />
(affective regulation of memory)<br />
HIP: Hippocampus<br />
(memory consolidation)<br />
PFC: prefrontal cortex<br />
(working memory and executive function)<br />
Amy F.T. Arnsten et al. Trends in Mol. Med.
Mechanistic Pharmacology Platform in <strong>Support</strong> <strong>Drug</strong><br />
Candidate Selection – Cognition Improvement (CNS)<br />
• Screen Model testing<br />
NOR-test : rodent<br />
• Agnosia Model Testing<br />
NOR- aged rodent<br />
NOR- scopolamine challenge: rodent.<br />
• Spatial Memory Testing<br />
MWM- aged rodent<br />
MWM- scoploamine challenge: rodent and/or primate<br />
• Executive Function Testing<br />
DMTP- scopolamine challenge (rodent)<br />
DMTP- aged primate: primate
Apply <strong>Biomarker</strong> <strong>Information</strong> to Define<br />
Candidate Profiles at Early Stage<br />
Develop Long-acting Therapy<br />
• Business<br />
‣Multi-billion dollar market<br />
‣Current situation<br />
• Medically:<br />
‣May help reduce the infection at<br />
dosing site (s.c. qd)<br />
‣Once/week convenience<br />
• PEGSYS success<br />
Target Profile<br />
• Once weekly dosing for<br />
‣Mylosuppressive Neutropenia<br />
‣PBPC<br />
• Efficacy<br />
Equal or better than Filgrastim<br />
• Safety<br />
Comparable safety
Graphic Illustration -- Mechanism of Action<br />
Stem Cell<br />
Myeloblast<br />
Bone<br />
in circulation<br />
Polymorphonuclear<br />
Neutrophils<br />
Promyelocyte<br />
Stimulation<br />
G-CSF<br />
GM-CSF<br />
Stimulation<br />
Neutrophil<br />
myelocye<br />
Organs & Tissues (extra-vascular site)<br />
Polymorphonuclear<br />
Neutrophils<br />
Polymorphonuclear<br />
Neutrophils
Proposed PK/PD Model of the Effect of<br />
PEG-G / G-CSF on Neutrophil<br />
k a<br />
Plasma PEG-G / G-CSF Conc. & Vd<br />
k e<br />
Stem<br />
Cell<br />
S1<br />
k g<br />
‘E max<br />
‘EC 50<br />
‘γ<br />
M<br />
τ<br />
WBC<br />
(In circulation)<br />
E max<br />
EC 50<br />
γ<br />
k in<br />
k out<br />
S2<br />
WBC<br />
Extra vascular<br />
site
Model Prediction vs Literature Values<br />
60<br />
: Result from clinical study<br />
:<br />
Results of Model predication<br />
30<br />
0<br />
0 5 29 53 77 101 125<br />
Time (hr)
Rationale of Defining Candidate Profiles<br />
Plasma Conc. (ng/ml)<br />
1000<br />
100<br />
10<br />
1<br />
0.1<br />
0.01<br />
EC50<br />
half-Vd double alpha-HL<br />
double beta-HL<br />
0 20 40 60 80<br />
Time (hr)
Effect of PEG-G & Filgrastim on ANC Induction<br />
6 0 0 0 0<br />
30 μg/kg<br />
4 0 0 0 0<br />
2 0 0 0 0<br />
Red Line: PEG-G<br />
single dose<br />
ANC (/mm 3 )<br />
0<br />
6 0 0 0 0<br />
4 0 0 0 0<br />
2 0 0 0 0<br />
0<br />
6 0 0 0 0<br />
0 5 0 1 0 0 1 5 0 2 0 0<br />
60 μg/kg<br />
0 5 0 1 0 0 1 5 0 2 0 0<br />
100 μg/kg<br />
Blue line: Filgrastim<br />
10 μg/kg qd.<br />
Black line: Placebo<br />
4 0 0 0 0<br />
2 0 0 0 0<br />
0<br />
0 5 0 1 0 0 1 5 0 2 0 0<br />
6 0 0 0 0<br />
150 μg/kg<br />
4 0 0 0 0<br />
2 0 0 0 0<br />
0<br />
0 5 0 1 0 0 1 5 0 2 0 0
Mean CFU-GM Colony Formation Profiles Following<br />
PEG-G or Filgrastim S.C in Healthy Subjects<br />
300<br />
300<br />
CFU-GM (10 -6 cells)<br />
30 μg/kg 60 μg/kg<br />
200<br />
100<br />
0<br />
0 50 100 150 200 250 300<br />
300<br />
200<br />
200<br />
200<br />
100<br />
0<br />
0 50 100 150 200 250 300<br />
300<br />
100 μg/kg 150 μg/kg<br />
Red Line: PEG-G, SD<br />
Blue line: F 5 μg/kg, qd<br />
Green line: F 10 μg/kg, qd<br />
100<br />
100<br />
0<br />
0 50 100 150 200 250 300<br />
0<br />
0 50 100 150 200 250 300<br />
Time (hours)
Mean BFU-E Colony Formation Profiles Following PEG-<br />
G or Filgrastim S.C in Healthy Subjects<br />
BFU-E (10 -6 cells)<br />
300<br />
200<br />
100<br />
0<br />
300<br />
200<br />
100<br />
30 μg 60 μg<br />
0 50 100 150 200 250<br />
0 50 100 150 200 250<br />
100 μg<br />
300<br />
200<br />
100<br />
0<br />
300<br />
200<br />
100<br />
150 μg<br />
Red Line: PEG-G, SD<br />
Blue line: placebo<br />
Green line: F 10 μg/kg, qd<br />
0<br />
0 50 100 150 200 250<br />
0<br />
0 50 100 150 200 250<br />
Time (hours)
SUMMARY<br />
• <strong>Biomarker</strong>: same principles with new name <br />
broader coverage and Sig. impact<br />
• Values of having high degree surrogacy<br />
information<br />
• Benefit of being Critical<br />
• Importance of setting up adequate assumptions<br />
• <strong>To</strong>ol: Modeling & simulation
Acknowledgment<br />
PEGSYS Project:<br />
PKA signaling pathway<br />
PEG-GM-CSF Project:<br />
Pascal Bailon<br />
Dennis Keith<br />
Mary Graves<br />
Michael Brenda<br />
Alicia Palleroni<br />
Ann Goldstein<br />
Indra Patel<br />
Peter VanBrummelen<br />
Stephane Dickenson<br />
Joseph Hoffman<br />
Simon Pedder<br />
……..<br />
Rudy Schreiber<br />
Robert England<br />
Dennis Deptula<br />
Elizabeth Ashford<br />
Pascal Bailon<br />
Eric Platza<br />
Terry Hays<br />
Indra Patel