

2009 Report - Pennsylvania Public Utility Commission
2009 Report - Pennsylvania Public Utility Commission
2009 Report - Pennsylvania Public Utility Commission

Create successful ePaper yourself
Turn your PDF publications into a flip-book with our unique Google optimized e-Paper software.
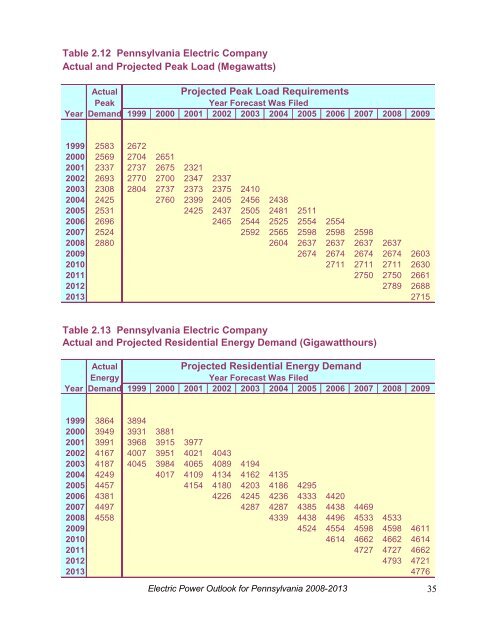
Table 2.12 <strong>Pennsylvania</strong> Electric Company<br />
Actual and Projected Peak Load (Megawatts)<br />
Actual<br />
Projected Peak Load Requirements<br />
Peak<br />
Year Forecast Was Filed<br />
Year Demand 1999 2000 2001 2002 2003 2004 2005 2006 2007 2008 <strong>2009</strong><br />
1999 2583 2672<br />
2000 2569 2704 2651<br />
2001 2337 2737 2675 2321<br />
2002 2693 2770 2700 2347 2337<br />
2003 2308 2804 2737 2373 2375 2410<br />
2004 2425 2760 2399 2405 2456 2438<br />
2005 2531 2425 2437 2505 2481 2511<br />
2006 2696 2465 2544 2525 2554 2554<br />
2007 2524 2592 2565 2598 2598 2598<br />
2008 2880 2604 2637 2637 2637 2637<br />
<strong>2009</strong> 2674 2674 2674 2674 2603<br />
2010 2711 2711 2711 2630<br />
2011 2750 2750 2661<br />
2012 2789 2688<br />
2013 2715<br />
Table 2.13 <strong>Pennsylvania</strong> Electric Company<br />
Actual and Projected Residential Energy Demand (Gigawatthours)<br />
Actual<br />
Projected Residential Energy Demand<br />
Energy<br />
Year Forecast Was Filed<br />
Year Demand 1999 2000 2001 2002 2003 2004 2005 2006 2007 2008 <strong>2009</strong><br />
1999 3864 3894<br />
2000 3949 3931 3881<br />
2001 3991 3968 3915 3977<br />
2002 4167 4007 3951 4021 4043<br />
2003 4187 4045 3984 4065 4089 4194<br />
2004 4249 4017 4109 4134 4162 4135<br />
2005 4457 4154 4180 4203 4186 4295<br />
2006 4381 4226 4245 4236 4333 4420<br />
2007 4497 4287 4287 4385 4438 4469<br />
2008 4558 4339 4438 4496 4533 4533<br />
<strong>2009</strong> 4524 4554 4598 4598 4611<br />
2010 4614 4662 4662 4614<br />
2011 4727 4727 4662<br />
2012 4793 4721<br />
2013 4776<br />
Electric Power Outlook for <strong>Pennsylvania</strong> 2008-2013 35


