

2009 Report - Pennsylvania Public Utility Commission
2009 Report - Pennsylvania Public Utility Commission
2009 Report - Pennsylvania Public Utility Commission

Create successful ePaper yourself
Turn your PDF publications into a flip-book with our unique Google optimized e-Paper software.
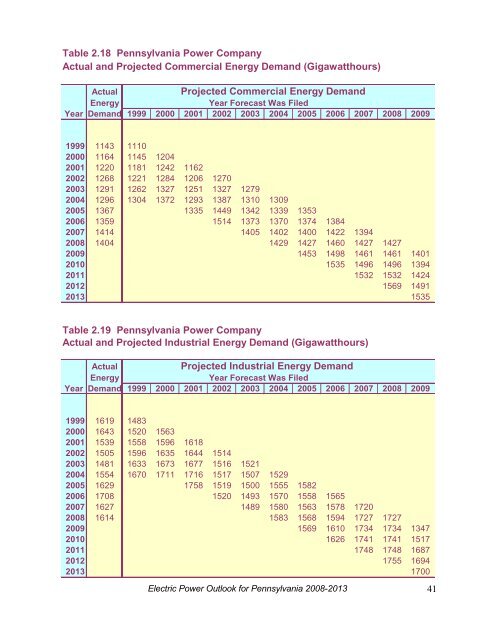
Table 2.18 <strong>Pennsylvania</strong> Power Company<br />
Actual and Projected Commercial Energy Demand (Gigawatthours)<br />
Actual<br />
Projected Commercial Energy Demand<br />
Energy<br />
Year Forecast Was Filed<br />
Year Demand 1999 2000 2001 2002 2003 2004 2005 2006 2007 2008 <strong>2009</strong><br />
1999 1143 1110<br />
2000 1164 1145 1204<br />
2001 1220 1181 1242 1162<br />
2002 1268 1221 1284 1206 1270<br />
2003 1291 1262 1327 1251 1327 1279<br />
2004 1296 1304 1372 1293 1387 1310 1309<br />
2005 1367 1335 1449 1342 1339 1353<br />
2006 1359 1514 1373 1370 1374 1384<br />
2007 1414 1405 1402 1400 1422 1394<br />
2008 1404 1429 1427 1460 1427 1427<br />
<strong>2009</strong> 1453 1498 1461 1461 1401<br />
2010 1535 1496 1496 1394<br />
2011 1532 1532 1424<br />
2012 1569 1491<br />
2013 1535<br />
Table 2.19 <strong>Pennsylvania</strong> Power Company<br />
Actual and Projected Industrial Energy Demand (Gigawatthours)<br />
Actual<br />
Projected Industrial Energy Demand<br />
Energy<br />
Year Forecast Was Filed<br />
Year Demand 1999 2000 2001 2002 2003 2004 2005 2006 2007 2008 <strong>2009</strong><br />
1999 1619 1483<br />
2000 1643 1520 1563<br />
2001 1539 1558 1596 1618<br />
2002 1505 1596 1635 1644 1514<br />
2003 1481 1633 1673 1677 1516 1521<br />
2004 1554 1670 1711 1716 1517 1507 1529<br />
2005 1629 1758 1519 1500 1555 1582<br />
2006 1708 1520 1493 1570 1558 1565<br />
2007 1627 1489 1580 1563 1578 1720<br />
2008 1614 1583 1568 1594 1727 1727<br />
<strong>2009</strong> 1569 1610 1734 1734 1347<br />
2010 1626 1741 1741 1517<br />
2011 1748 1748 1687<br />
2012 1755 1694<br />
2013 1700<br />
Electric Power Outlook for <strong>Pennsylvania</strong> 2008-2013 41


