Pre-Algebra Chapter 6 - Ramsey School District
Pre-Algebra Chapter 6 - Ramsey School District
Pre-Algebra Chapter 6 - Ramsey School District

You also want an ePaper? Increase the reach of your titles
YUMPU automatically turns print PDFs into web optimized ePapers that Google loves.
A <strong>Pre</strong>view of Lesson 6-9<br />
Taking a Survey<br />
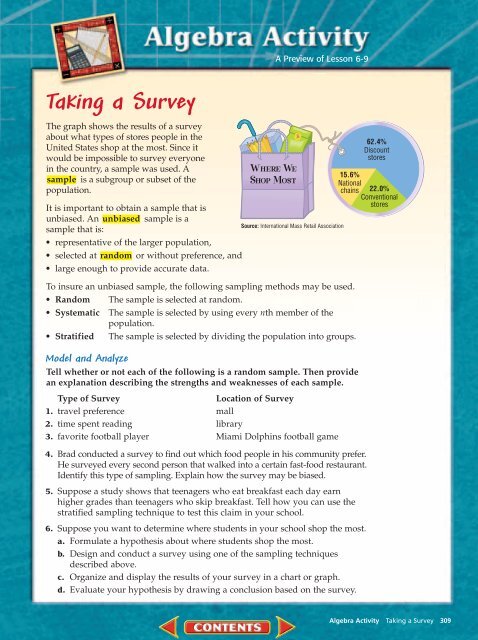
The graph shows the results of a survey<br />
about what types of stores people in the<br />
United States shop at the most. Since it<br />
would be impossible to survey everyone<br />
in the country, a sample was used. A<br />
sample is a subgroup or subset of the<br />
population.<br />
It is important to obtain a sample that is<br />
unbiased. An unbiased sample is a<br />
sample that is:<br />
• representative of the larger population,<br />
• selected at random or without preference, and<br />
• large enough to provide accurate data.<br />
Source: International Mass Retail Association<br />
To insure an unbiased sample, the following sampling methods may be used.<br />
• Random The sample is selected at random.<br />
• Systematic The sample is selected by using every nth member of the<br />
population.<br />
• Stratified The sample is selected by dividing the population into groups.<br />
Model and Analyze<br />
Tell whether or not each of the following is a random sample. Then provide<br />
an explanation describing the strengths and weaknesses of each sample.<br />
Type of Survey<br />
Location of Survey<br />
1. travel preference mall<br />
2. time spent reading library<br />
3. favorite football player Miami Dolphins football game<br />
4. Brad conducted a survey to find out which food people in his community prefer.<br />
He surveyed every second person that walked into a certain fast-food restaurant.<br />
Identify this type of sampling. Explain how the survey may be biased.<br />
5. Suppose a study shows that teenagers who eat breakfast each day earn<br />
higher grades than teenagers who skip breakfast. Tell how you can use the<br />
stratified sampling technique to test this claim in your school.<br />
6. Suppose you want to determine where students in your school shop the most.<br />
a. Formulate a hypothesis about where students shop the most.<br />
b. Design and conduct a survey using one of the sampling techniques<br />
described above.<br />
c. Organize and display the results of your survey in a chart or graph.<br />
d. Evaluate your hypothesis by drawing a conclusion based on the survey.<br />
62.4%<br />
Discount<br />
stores<br />
15.6%<br />
National<br />
chains 22.0%<br />
Conventional<br />
stores<br />
Investigating Slope-Intercept Form 309<br />
<strong>Algebra</strong> Activity Taking a Survey 309