characterization of group-iii nitride semiconductors by x-ray ... - Rigaku
characterization of group-iii nitride semiconductors by x-ray ... - Rigaku
characterization of group-iii nitride semiconductors by x-ray ... - Rigaku

You also want an ePaper? Increase the reach of your titles
YUMPU automatically turns print PDFs into web optimized ePapers that Google loves.
The <strong>Rigaku</strong> Journal<br />
Vol. 17/ No. 2/ 2000<br />
CONTRIBUTED PAPERS<br />
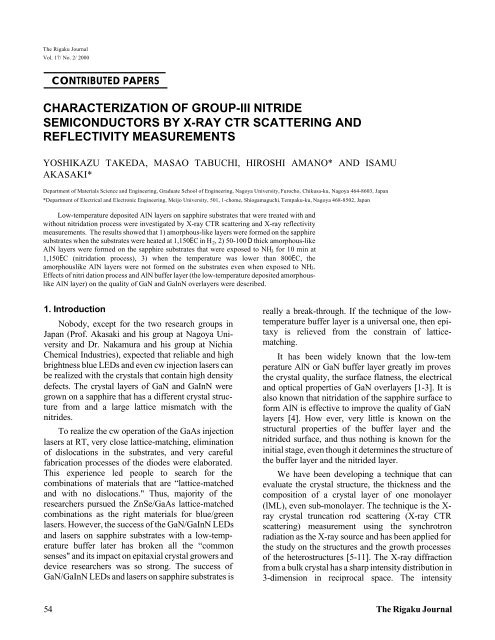
CHARACTERIZATION OF GROUP-III NITRIDE<br />
SEMICONDUCTORS BY X-RAY CTR SCATTERING AND<br />
REFLECTIVITY MEASUREMENTS<br />
YOSHIKAZU TAKEDA, MASAO TABUCHI, HIROSHI AMANO* AND ISAMU<br />
AKASAKI*<br />
Department <strong>of</strong> Materials Science and Engineering, Graduate School <strong>of</strong> Engineering, Nagoya University, Furocho, Chikusa-ku, Nagoya 464-8603, Japan<br />
*Department <strong>of</strong> Electrical and Electronic Engineering, Meijo University, 501, 1-chome, Shiogamaguchi, Tempaku-ku, Nagoya 468-8502, Japan<br />
Low-temperature deposited AlN layers on sapphire substrates that were treated with and<br />
without nitridation process were investigated <strong>by</strong> X-<strong>ray</strong> CTR scattering and X-<strong>ray</strong> reflectivity<br />
measurements. The results showed that 1) amorphous-like layers were formed on the sapphire<br />
substrates when the substrates were heated at 1,150EC in H 2 , 2) 50-100 D thick amorphous-like<br />
AlN layers were formed on the sapphire substrates that were exposed to NH 3 for 10 min at<br />
1,150EC (nitridation process), 3) when the temperature was lower than 800EC, the<br />
amorphouslike AlN layers were not formed on the substrates even when exposed to NH3.<br />
Effects <strong>of</strong> nitri dation process and AlN buffer layer (the low-temperature deposited amorphouslike<br />
AlN layer) on the quality <strong>of</strong> GaN and GaInN overlayers were described.<br />
1. Introduction<br />
Nobody, except for the two research <strong>group</strong>s in<br />
Japan (Pr<strong>of</strong>. Akasaki and his <strong>group</strong> at Nagoya University<br />
and Dr. Nakamura and his <strong>group</strong> at Nichia<br />
Chemical Industries), expected that reliable and high<br />
brightness blue LEDs and even cw injection lasers can<br />
be realized with the crystals that contain high density<br />
defects. The crystal layers <strong>of</strong> GaN and GaInN were<br />
grown on a sapphire that has a different crystal structure<br />
from and a large lattice mismatch with the<br />
<strong>nitride</strong>s.<br />
To realize the cw operation <strong>of</strong> the GaAs injection<br />
lasers at RT, very close lattice-matching, elimination<br />
<strong>of</strong> dislocations in the substrates, and very careful<br />
fabrication processes <strong>of</strong> the diodes were elaborated.<br />
This experience led people to search for the<br />
combinations <strong>of</strong> materials that are “lattice-matched<br />
and with no dislocations." Thus, majority <strong>of</strong> the<br />
researchers pursued the ZnSe/GaAs lattice-matched<br />
combinations as the right materials for blue/green<br />
lasers. However, the success <strong>of</strong> the GaN/GaInN LEDs<br />
and lasers on sapphire substrates with a low-temperature<br />
buffer later has broken all the “common<br />
senses" and its impact on epitaxial crystal growers and<br />
device researchers was so strong. The success <strong>of</strong><br />
GaN/GaInN LEDs and lasers on sapphire substrates is<br />
really a break-through. If the technique <strong>of</strong> the lowtemperature<br />
buffer layer is a universal one, then epitaxy<br />
is relieved from the constrain <strong>of</strong> latticematching.<br />
It has been widely known that the low-tem<br />
perature AlN or GaN buffer layer greatly im proves<br />
the crystal quality, the surface flatness, the electrical<br />
and optical properties <strong>of</strong> GaN overlayers [1-3]. It is<br />
also known that nitridation <strong>of</strong> the sapphire surface to<br />
form AlN is effective to improve the quality <strong>of</strong> GaN<br />
layers [4]. How ever, very little is known on the<br />
structural properties <strong>of</strong> the buffer layer and the<br />
<strong>nitride</strong>d surface, and thus nothing is known for the<br />
initial stage, even though it determines the structure <strong>of</strong><br />
the buffer layer and the <strong>nitride</strong>d layer.<br />
We have been developing a technique that can<br />
evaluate the crystal structure, the thickness and the<br />
composition <strong>of</strong> a crystal layer <strong>of</strong> one monolayer<br />
(lML), even sub-monolayer. The technique is the X-<br />
<strong>ray</strong> crystal truncation rod scattering (X-<strong>ray</strong> CTR<br />
scattering) measurement using the synchrotron<br />
radiation as the X-<strong>ray</strong> source and has been applied for<br />
the study on the structures and the growth processes<br />
<strong>of</strong> the heterostructures [5-11]. The X-<strong>ray</strong> diffraction<br />
from a bulk crystal has a sharp intensity distribution in<br />
3-dimension in reciprocal space. The intensity<br />
54 The <strong>Rigaku</strong> Journal
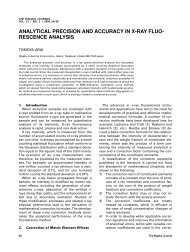
Fig. 2. Temperature sequence for deposition <strong>of</strong> AlN<br />
with nitridation process. NH3 is supplied to the<br />
sapphire surface at 1,150EC for 10 min.<br />
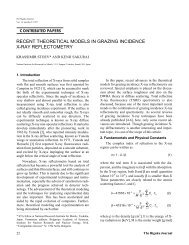
Fig. 1. Calculated spectra <strong>of</strong> X-<strong>ray</strong> CTR scattering from<br />
INP (002) (a) and from INP(10nm)/ Ga 0.47 In 0.53<br />
As(10ML)/ InP (b). Due to heterostructure the tail portion<br />
<strong>of</strong> the spectrum (b) is largely modulated.<br />
distribution <strong>of</strong> the diffraction from a crystal surface<br />
spreads, (looks like a rod in the reciprocal space),<br />
perpendicular to the surface due to the truncation <strong>of</strong><br />
the periodicity <strong>of</strong> the crystal and is called as the X-<strong>ray</strong><br />
CTR scattering [12-14]. Examples <strong>of</strong> the CTR<br />
scattering spectra are illustrated in Fig. 1 (a) and (b).<br />
Figure 1 (a) is the X-<strong>ray</strong> intensity distribution along<br />
(00x) <strong>of</strong> In P. It shows a sharp Bragg peak at x =2 and at<br />
the same time has widely spread tails on both sides.<br />
When the same measurement is done for the<br />
heterostructure <strong>of</strong> InP(10nm)/ Ga 0.47 In 0.53 As(10ML)/<br />
InP substrate, the X-<strong>ray</strong> i n tensity distribution is<br />
largely modified in the tail part <strong>of</strong> the intensity<br />
distribution as illustrated in Fig. 1 (b). From the figure<br />
we can see that the spectrum is <strong>of</strong> information rich.<br />
Since the information rich part is 10 -5 -10 -6 <strong>of</strong> the<br />
Bragg peak in intensity, a high intensity X-<strong>ray</strong> source<br />
such as the synchrotron radiation is necessary for the<br />
measurement.<br />
The X-<strong>ray</strong> CTR scattering is useful for crys talline<br />
layer analysis since it is basically originated from the<br />
X-<strong>ray</strong> diffraction. The low-temperature AlN and GaN<br />
buffer layers are thought to be fine polycrystals or<br />
amorphous. To characterize them, the X-<strong>ray</strong> reflectivity<br />
measurement has been done. The reflectivity in<br />
the angle range from the total reflection to several de<br />
grees is modulated <strong>by</strong> the electron density and the<br />
layer thickness. The formula is established <strong>by</strong> Parratt<br />
et al. in 1950 and has been used as a non-destructive<br />
thickness measurements [15, 16]. Recently, <strong>by</strong> the X-<br />
<strong>ray</strong> reflectivity, the thickness <strong>of</strong> several nm is measured<br />
and the interface structure is evaluated [17-20].<br />
In the present experiments, we prepared the<br />
sapphire substrates with and without the nitridation<br />
process and deposited the low-temperature AlN<br />
buffer layer, the GaN layer and the GaInN layer. The<br />
growth was stopped at each stage, samples were<br />
cooled down and used for the measurements. From<br />
the analysis <strong>of</strong> the X-<strong>ray</strong> CTR scattering spectra and<br />
the X-<strong>ray</strong> reflectivity spectra the structures, the thicknesses<br />
and the crystalline quality were evaluated and<br />
corre lated with the growth processes.<br />
2. Sample Preparation<br />
The samples were grown <strong>by</strong> MOVPE (metalorganic<br />
vapor phase epitaxy). Figures 2 and 3 show<br />
the growth sequences. Figure 2 includes the nitridation<br />
process before deposition <strong>of</strong> the AlN buffer layer.<br />
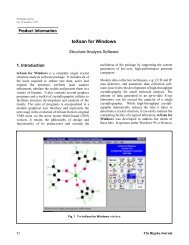
Figure 3 skips the nitridation process <strong>by</strong> flowing NH 3<br />
only after the substrate temperature is lower than<br />
800EC. Those numbers ˛, ª, ... on the temperature<br />
sequences are the stages where the process was<br />
stopped and the temperature was rapidly decreased.<br />
The samples have the same numbers as in Figs. 2<br />
and 3. The sample ˛ was heated upto 1,150EC in H 2<br />
and then quickly cooled down, and the sample ˇ was<br />
kept for 5 min. The samples — and go through the<br />
high temperature heat treatment in H 2 or NH 3 ,<br />
Vol. 17 No. 2 2000 55
Fig. 3. Temperature sequence for deposition <strong>of</strong> AlN<br />
without nitridation process. NH 3 is supplied to the<br />
sapphire surface at temperatures lower than 800EC.<br />
respectively and are cooled down just before the AlN<br />
deposition. The samples and have the lowtemperature<br />
deposited AlN buffer layer with the<br />
thickness <strong>of</strong> 30 D (designed value).<br />
GaN and GaInN layers were grown continuously<br />
after deposition <strong>of</strong> 300 D-thick AlN buffer layer.<br />
3. Measurements<br />
X-<strong>ray</strong> CTR scattering measurements were conducted<br />
at the beam line BL6A in the Photon Factory in<br />
Tsukuba using the Weissenberg camera (R-AXIS-<br />
RAPID, <strong>Rigaku</strong>) and the imaging plate (IP) as the 2-<br />
dimensional detector. The camera length was fixed at<br />
286.5 mm and the wavelength <strong>of</strong> the X-<strong>ray</strong> at 1.600 D.<br />
The angle ω <strong>of</strong> the sample was scanned in the range<br />
between 2E higher and 8E lower than the (0006) Bragg<br />
point <strong>of</strong> sapphire.<br />
The X-<strong>ray</strong> reflectivity measurements in the low<br />
glancing angle was conducted using the conventional<br />
X-<strong>ray</strong> generator and diffractometer (RUH-450, <strong>Rigaku</strong>).<br />
The target was Cu operated at 35 kV with 330<br />
mA. The Cu K αl (λ=1.54056 D) line was chosen using<br />
Si(111) monochromator. The receiving slit was 0.05<br />
mm.<br />
4. Results and Analysis<br />
The process for the analysis <strong>of</strong> the measured data<br />
is basically the same for the CTR scattering and for<br />
the reflectivity. 1) A model for the layer structure is<br />
constructed. 2) The X-<strong>ray</strong> CTR scattering spectrum or<br />
the reflectivity spectrum is generated <strong>by</strong> a computer<br />
simulation from the model. 3) By changing those<br />
parameters in the model structure the generated<br />
spectra and the measured data are compared. 4) At the<br />
best fit, the set <strong>of</strong> parameters are considered to give<br />
the most probable structure <strong>of</strong> the layer.<br />
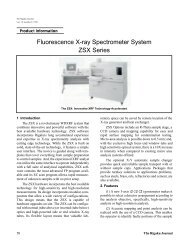
Fig. 4. X-<strong>ray</strong> CTR scattering spectrum <strong>of</strong> the <strong>nitride</strong>d<br />
sapphire surface. Dots are the measured data and the<br />
g<strong>ray</strong> line is the best fit curve.<br />
In the CTR scattering, the atom arrangements in<br />
each layer are the primary information to be obtained.<br />
In the reflectivity, the electron density in each layer is<br />
the primary information to be obtained. Therefore,<br />
good crystalline part <strong>of</strong> the layer is detected <strong>by</strong> the<br />
CTR scattering, and all <strong>of</strong> the crystalline, polycrystalline<br />
and amorphous part are detected <strong>by</strong> the<br />
reflectivity mea surements.<br />
4.1. X-<strong>ray</strong> CTR scattering<br />
The samples ˛ and ˇ showed no specific features<br />
in the X-<strong>ray</strong> CTR scattering spectra, i.e., those were<br />
the same as the spectrum <strong>of</strong> the sapphire substrate.<br />
On the other hand, the sample — had a clear bump<br />
in the lower angle side <strong>of</strong> the sapphire peak as shown<br />
in Fig. 4. In the figure dots are the measured data and<br />
the g<strong>ray</strong> line is the best fit curve. Since the sample —<br />
was the <strong>nitride</strong>d sapphire in the NH 3 atmosphere, the<br />
surface <strong>of</strong> the sapphire (Al 2 O 3 ) is considered to be<br />
converted to AlN. For the analysis <strong>by</strong> curve fitting,<br />
several possible model structures were as sumed; Al<br />
in AlN is bonded to Al or O in sapphire, or N in AlN is<br />
bonded to Al or O in sapphire, the polarity <strong>of</strong> AlN is<br />
[0001]A or [0001]B, the top surface <strong>of</strong> AlN is covered<br />
<strong>by</strong> Al or N, the thickness <strong>of</strong> AlN, the roughness <strong>of</strong><br />
AlN surface, the lattice distortion <strong>of</strong> AlN, and so on.<br />
The results <strong>of</strong> the analysis are illustrated in Fig 5.<br />
The thickness <strong>of</strong> the AlN layer was 3ML (7.47 D), the<br />
polarity was [0001]A, and the top surface <strong>of</strong> AlN was<br />
mostly covered <strong>by</strong> N.<br />
In the other samples - , the spectra were not<br />
clear and good fitting was not obtained. We considered<br />
that amorphous-like AlN containing fine<br />
56 The <strong>Rigaku</strong> Journal
Fig. 5. Schematic drawing <strong>of</strong> the layer structure for the<br />
sample in Fig. 4.<br />
Fig. 7. X-<strong>ray</strong> reflectivity spectra <strong>of</strong> sapphire surface<br />
heat-treated in NH 3 at 1,150EC for 10 min (nitridation)<br />
(sample —) and then AlN deposited (sample ).<br />
Fig. 6. X-<strong>ray</strong> reflectivity spectra <strong>of</strong> sapphire surface<br />
heat-treated in H 2 at 1,150EC for 0 min (sample ˛) and 5<br />
min (sample ˇ).<br />
polycrystals was deposied and it did not give a clear<br />
peak in the spectra.<br />
4.2 X-<strong>ray</strong> Reflectivity<br />
The measured data are shown in Figs. 6-8. The<br />
dots are the measured data and the g<strong>ray</strong> lines are the<br />
best fit curves.<br />
In the model layer structure, three different layers<br />
were assumed to exist on the sapphire substrate. The<br />
top surface layer is that formed <strong>by</strong> adsorption in the<br />
air. The bottom layer is that formed <strong>by</strong> the heat<br />
treatment in H 2 or in NH 3 (nitridation before<br />
deposition <strong>of</strong> the AlN buffer layer. Between them is<br />
the AlN layer depositied at the low temperature. The<br />
Fresnel equations were used for the X-<strong>ray</strong> reflectivity<br />
and calculated using the technique developed <strong>by</strong><br />
Parratt et al. [15,16]. In Table 1 the results <strong>of</strong><br />
Fig. 8. X-<strong>ray</strong> reflectivity spectra <strong>of</strong> sapphire surface<br />
without nitridation (sample ) and then AlN deposited<br />
(sample ).<br />
parameters obtained from the best fit curves in Figs.<br />
6-8 are listed.<br />
The samples ˛ and ˇ are the sapphire heattreated<br />
in H 2 at 1,150EC for 0 min and 5 min, respectively.<br />
The slight modulation in the reflectivity spectra<br />
indicates that there is a layer (or layers) on top <strong>of</strong><br />
the sapphire. From the Table 1, a very thin layer with<br />
the density about 3 gcm -3 is formed. Comparing the<br />
density with those <strong>of</strong> sapphire (4), crystal AlN (3.26)<br />
and metal Al (2.7), we considered that this layer is Al<br />
formed <strong>by</strong> the desorption <strong>of</strong> 0 from the sapphire<br />
surface and/or AlN (or AlO x N y ) formed <strong>by</strong> reaction<br />
with residual NH 3 in the reaction chamber. The X-<strong>ray</strong><br />
CTR scattering spectra <strong>of</strong> the samples ˛and ˇwere<br />
the same as that <strong>of</strong> sapphire substrate as supplied from<br />
a vender. It means that the layer found out in the<br />
samples ˛ and ˇ are amorphous-like or fine poly-<br />
Vol. 17 No. 2 2000 57
Table 1. Parameters obtained <strong>by</strong> the analysis <strong>of</strong> X-<strong>ray</strong> reflectivity<br />
spectra.<br />
Sample No. 1 2 3 4 5 6<br />
1st layer (top<br />
surface)<br />
2nd layer<br />
3rd layer<br />
Density<br />
(g/cm 3 )<br />
0.98 0.70 0.97 1.19 0.98 1.19<br />
Thickness 7.1 20.1 11.9 12.0 17.9 12.8<br />
Density<br />
(g/cm 3 )<br />
- - - 2.95 - 3.06<br />
Thickness - - - 4.5 - 6.4<br />
Density<br />
(g/cm 3 )<br />
2.97 2.64 3.04 3.04 2.63 2.34<br />
Thickness 13.7 10.2 113.0 42.0 10.1 11.3<br />
crystals. The top layers in all the samples are not<br />
discussed here, but though to be adsorbed water vapor<br />
in the air.<br />
In Fig. 7, the number <strong>of</strong> oscillatory structure is<br />
more and clear. It indicates that a thicker layer is<br />
formed <strong>by</strong> the nitridation process and the deposition<br />
<strong>of</strong> AlN. In Fig. 8, the number <strong>of</strong> the oscillatory<br />
structure is less.<br />
When the sample — (with nitridation process) and<br />
the sample (without nitridation process) are<br />
compared, the largest difference is the thickness <strong>of</strong> the<br />
third layers. In the sample — it is as thick as about 100<br />
D. From the preparation process and the density this<br />
layer is understood to be AlN formed <strong>by</strong> the nitridation<br />
process. As was shown in Fig. 4, the thickness <strong>of</strong><br />
the crystalline AlN layer obtained <strong>by</strong> the X-<strong>ray</strong> CTR<br />
scat tering was only 3 ML. Considering both results, a<br />
good crystalline thin (3 ML) AlN layer is generated at<br />
the beginning <strong>of</strong> the nitridation process and after that<br />
amorphous-like layer is formed. The layer structure <strong>of</strong><br />
the sample is almost the same as that <strong>of</strong> sample ˇ. It<br />
means that the sapphire surface is not affected <strong>by</strong> the<br />
supply <strong>of</strong> NH 3 at temperatures lower than 800EC.<br />
By the deposition <strong>of</strong> AlN at 400EC, very thin AlN<br />
layers <strong>of</strong> only several A are deposited, as shown in<br />
Table 1 (samples and ), though the thickness was<br />
designed to be 30 D. The reason for this is not known,<br />
but we consider that for the initial short period <strong>of</strong> the<br />
AlN deposition process, the supply <strong>of</strong> source gases<br />
may not reach to the expected flow rates.<br />
In the comparison <strong>of</strong> the samples — and the<br />
difference <strong>of</strong> the AlN thickness formed <strong>by</strong> the nitridation<br />
process is large. This result may also indicate that<br />
the nitridation process is not very controllable, due to<br />
fluctuation <strong>of</strong> the supply <strong>of</strong> NH 3 or due to surface<br />
conditions <strong>of</strong> sapphire.<br />
5. Summary<br />
By X-<strong>ray</strong> CTR scattering and X-<strong>ray</strong> reflectivity<br />
measurements, the layer structures, both crystalline<br />
and non-crystalline, after heat-treatment <strong>of</strong> sapphire<br />
surface in H 2 or in NH 3 (nitridation) at 1,150EC and<br />
after deposition <strong>of</strong> AlN layers at 400EC were<br />
analyzed.<br />
From the X-<strong>ray</strong> CTR scattering, a good<br />
crystalline AlN thin layer (3 ML) with the polarity <strong>of</strong><br />
[0001]A is formed <strong>by</strong> the nitridation process <strong>of</strong> the<br />
sapphire surface. In the other samples, good fitting to<br />
the spectra were not obtained. This may be due to fine<br />
polycrystalline layers or amorphous-like layers that<br />
do not contribute to the CTR signals.<br />
Considering the results both <strong>of</strong> the X-<strong>ray</strong> CTR<br />
scattering and reflectivity, followings were revealed.<br />
1) An amorphous-like layer is formed on the sapphire<br />
surface <strong>by</strong> the heat-treatment in H 2 at 1,150EC for<br />
several minutes. 2) An amorphous-like layer <strong>of</strong> the<br />
thickness <strong>of</strong> 50-100 D is formed on the sapphire<br />
surface <strong>by</strong> the heat treatment in NH 3 at 1,150EC for<br />
10min. 3) The sapphire surface is not affected <strong>by</strong> NH 3<br />
at temperatures lower than 800EC.<br />
Though it was not described in the text, the effects<br />
<strong>of</strong> those different processes for the deposition <strong>of</strong> AlN<br />
buffer layers on the final structure <strong>of</strong> GaInN/GaN that<br />
are used for most device applications were examined.<br />
The X-<strong>ray</strong> CTR scattering spectra for GaInN(40<br />
D)/GaN(2µm)/ AlN buffer/sapphire with (Fig. 9) and<br />
without (Fig. 10) the nitridation process. In Fig. 9, a<br />
clear AlN peak is observed. This means that more<br />
crystalline AlN is formed due to already existed crystalline<br />
AlN generated <strong>by</strong> the nitridation process, probably<br />
during the heating process before growth <strong>of</strong> GaN<br />
at 1,100EC. More crystalline AlN results in a simple<br />
shape <strong>of</strong> the X-<strong>ray</strong> CTR scattering spectrum <strong>of</strong> the<br />
GaInN/GaN layer. The difference is very clear when<br />
com pared with the spectrum in Fig. 10. The modulation<br />
in the spectrum in Fig. 10 is due to the thickness<br />
fringe <strong>of</strong> the flat GaInN layer. The peak from AlN is<br />
not observed. Thus, without the nitridation process,<br />
the low-temperature deposited AlN layer remained as<br />
amorphous-like layer even after the heating process to<br />
start growth <strong>of</strong> and during growth <strong>of</strong> GaN, and this<br />
amorphous-like AlN caused growth <strong>of</strong> a flat GaN<br />
layer and then a flat GaInN layer.<br />
58 The <strong>Rigaku</strong> Journal
as a part <strong>of</strong> the project 98GO79 accepted <strong>by</strong> the<br />
Photon Factory Program Advisory Committee.<br />
Fig. 9. X-<strong>ray</strong> CTR scattering spectra <strong>of</strong>r GaInN(40<br />
D)/GaN(2µm)/ AlN buffer/sapphire with nitridation<br />
process. AlN peak is sharp. Thickness fringe is not<br />
observed.<br />
Fig. 10. X-<strong>ray</strong> CTR scattering spectra for GaInN(40<br />
D)/GaN(2µm)/ AlN buffer/sapphire without the nitridation<br />
process. Thickness fringe due to flat GaInN layer is<br />
clearly seen.<br />
Acknowledgments<br />
This work was conducted as the Project “Dynamic<br />
Process and Control <strong>of</strong> the Buffer Layer at the<br />
Interfaces in a Highly-Mismatched System” <strong>of</strong> the<br />
JSPS Research for the Future Program in the Area <strong>of</strong><br />
Atomic-Scale Surface and Interface Dynamics. The<br />
X-<strong>ray</strong> CTR scattering measurements were performed<br />
References<br />
[1] H. Amano, N. Sawaki, I. Akasaki, and Y Toyoda, Appl.<br />
Phys. Lett., 48 (1986) 353-355.<br />
[2] S. Nakamura, Jpn. J. Appl. Phys., 30 (1991) L1705<br />
L1707.<br />
[3] I. Akasaki and H. Amano, Jpn. J. AppL Phys., 36<br />
(1997)5393-5408.<br />
[4] H. Kawakami, K. Sakurai, K. Tsubouchi, and N.<br />
Mikoshiba, Jpn. J. AppL Phys., 27 (1988) L161-Ll63.<br />
[5] Y. Takeda, Y Sakuraba, K. Fujibayashi, M. Tabuchi, T.<br />
Kumamoto, I. Takahashi, J. Harada, and H. Kamei,<br />
Appl. Phys. Lett., 66 (1995) 332-334.<br />
[6] M. Tabuchi, Y Takeda, Y Sakuraba, T. Kumamoto, K.<br />
Fujibayashi, I. Takahashi, J. Harada, and H. Kamie, J.<br />
Cryst. Growth, 146 (1995) 148-152.<br />
[7] M. Tabuchi, N. Matsumoto, Y Takeda, T Takeuchi, H.<br />
Amano, and I. Akasaki, J. Cryst. Growth, 189/190<br />
(1998) 291-294.<br />
[8] M. Tabuchi, Y Takeda, N. Matsumoto, H. Amano, and I.<br />
Akasaki, Jpn. J. Appl. Phys., 38 (1999) 281-284.<br />
[9] M. Tabuchi, R. Takahashi, M. Araki, K. Hi<strong>ray</strong>ama, N.<br />
Futakuchi, Y. Shimogaki, Y Nakano, and Y Takeda,<br />
Appl. Surf. Sci., 159-160 (2000) 250-255.<br />
[10] M. Tabuchi, K. Hi<strong>ray</strong>ama, Y. Takeda, T Takeuchi, H.<br />
Amano and I. Akasaki, Appl. Surf. Sci., 159-160<br />
(2000)432-440.<br />
[11] Y. Takeda and M. Tabuchi, InP and Related Corn<br />
pobnds.Chapter 10, Ed., M.O. Manasreh (Gordon and<br />
Breach, Amsterdam, 2000).<br />
[12] I. K. Robinson, Phys. Rev., B33 (1986) 3830-3836.<br />
[13] I. K. Robinson and D. J. Tweet, Rep. Prog. Phys., 55<br />
(1992) 599-651.<br />
[14] Y. Kashihara, S. Kimura, and J. Harada, Surf. Sci., 214<br />
(1989)477-492.<br />
[15] L. G. Parratt and C. F. Hempstead, Phys. Rev., 94<br />
(1954) 1593-1600.<br />
[16] L. G. Parratt, Phys. Rev., 95 (1954) 359-369.<br />
[17] H. Chen and S. M. Heald, J. Appl. Phys., 66 (1989)<br />
1793-1799.<br />
[18] S. M. Heald, J. K. D. Jayanetti, A. A. Bright, and G. W.<br />
Rubl<strong>of</strong>f, J. Vac. Sci. & Technol., A8 (1990) 2046-2048.<br />
[19] N. Awaji, Y Sugita, S. Ohkubo, T. Nakanishi, K.<br />
Takasaki, and S. Komiya, Jpn. J. Appl. Phys., 34 (1 995)<br />
Ll 01 3-Ll 01 6.<br />
[20] M. K. Sanyal, A. Datta, S. Banerjee, A. K. Srivastava, B.<br />
M. Arora, S. Kanakaraiu, and S. Mohan, J. Synch.<br />
Radiat., 4 (1997) 185-190.<br />
Vol. 17 No. 2 2000 59