characterization of group-iii nitride semiconductors by x-ray ... - Rigaku
characterization of group-iii nitride semiconductors by x-ray ... - Rigaku
characterization of group-iii nitride semiconductors by x-ray ... - Rigaku

You also want an ePaper? Increase the reach of your titles
YUMPU automatically turns print PDFs into web optimized ePapers that Google loves.
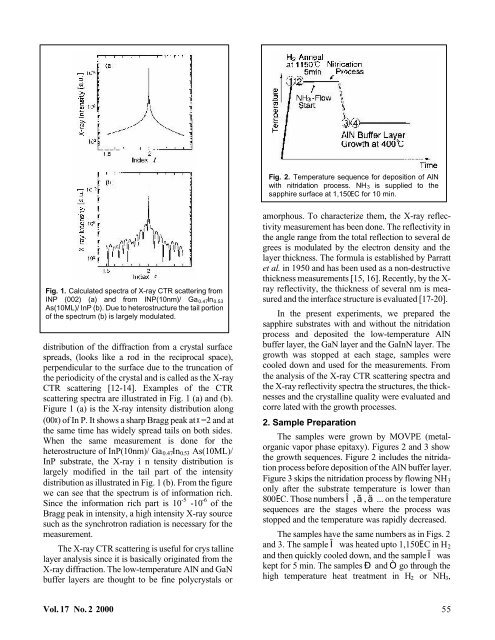
Fig. 2. Temperature sequence for deposition <strong>of</strong> AlN<br />
with nitridation process. NH3 is supplied to the<br />
sapphire surface at 1,150EC for 10 min.<br />
Fig. 1. Calculated spectra <strong>of</strong> X-<strong>ray</strong> CTR scattering from<br />
INP (002) (a) and from INP(10nm)/ Ga 0.47 In 0.53<br />
As(10ML)/ InP (b). Due to heterostructure the tail portion<br />
<strong>of</strong> the spectrum (b) is largely modulated.<br />
distribution <strong>of</strong> the diffraction from a crystal surface<br />
spreads, (looks like a rod in the reciprocal space),<br />
perpendicular to the surface due to the truncation <strong>of</strong><br />
the periodicity <strong>of</strong> the crystal and is called as the X-<strong>ray</strong><br />
CTR scattering [12-14]. Examples <strong>of</strong> the CTR<br />
scattering spectra are illustrated in Fig. 1 (a) and (b).<br />
Figure 1 (a) is the X-<strong>ray</strong> intensity distribution along<br />
(00x) <strong>of</strong> In P. It shows a sharp Bragg peak at x =2 and at<br />
the same time has widely spread tails on both sides.<br />
When the same measurement is done for the<br />
heterostructure <strong>of</strong> InP(10nm)/ Ga 0.47 In 0.53 As(10ML)/<br />
InP substrate, the X-<strong>ray</strong> i n tensity distribution is<br />
largely modified in the tail part <strong>of</strong> the intensity<br />
distribution as illustrated in Fig. 1 (b). From the figure<br />
we can see that the spectrum is <strong>of</strong> information rich.<br />
Since the information rich part is 10 -5 -10 -6 <strong>of</strong> the<br />
Bragg peak in intensity, a high intensity X-<strong>ray</strong> source<br />
such as the synchrotron radiation is necessary for the<br />
measurement.<br />
The X-<strong>ray</strong> CTR scattering is useful for crys talline<br />
layer analysis since it is basically originated from the<br />
X-<strong>ray</strong> diffraction. The low-temperature AlN and GaN<br />
buffer layers are thought to be fine polycrystals or<br />
amorphous. To characterize them, the X-<strong>ray</strong> reflectivity<br />
measurement has been done. The reflectivity in<br />
the angle range from the total reflection to several de<br />
grees is modulated <strong>by</strong> the electron density and the<br />
layer thickness. The formula is established <strong>by</strong> Parratt<br />
et al. in 1950 and has been used as a non-destructive<br />
thickness measurements [15, 16]. Recently, <strong>by</strong> the X-<br />
<strong>ray</strong> reflectivity, the thickness <strong>of</strong> several nm is measured<br />
and the interface structure is evaluated [17-20].<br />
In the present experiments, we prepared the<br />
sapphire substrates with and without the nitridation<br />
process and deposited the low-temperature AlN<br />
buffer layer, the GaN layer and the GaInN layer. The<br />
growth was stopped at each stage, samples were<br />
cooled down and used for the measurements. From<br />
the analysis <strong>of</strong> the X-<strong>ray</strong> CTR scattering spectra and<br />
the X-<strong>ray</strong> reflectivity spectra the structures, the thicknesses<br />
and the crystalline quality were evaluated and<br />
corre lated with the growth processes.<br />
2. Sample Preparation<br />
The samples were grown <strong>by</strong> MOVPE (metalorganic<br />
vapor phase epitaxy). Figures 2 and 3 show<br />
the growth sequences. Figure 2 includes the nitridation<br />
process before deposition <strong>of</strong> the AlN buffer layer.<br />
Figure 3 skips the nitridation process <strong>by</strong> flowing NH 3<br />
only after the substrate temperature is lower than<br />
800EC. Those numbers ˛, ª, ... on the temperature<br />
sequences are the stages where the process was<br />
stopped and the temperature was rapidly decreased.<br />
The samples have the same numbers as in Figs. 2<br />
and 3. The sample ˛ was heated upto 1,150EC in H 2<br />
and then quickly cooled down, and the sample ˇ was<br />
kept for 5 min. The samples — and go through the<br />
high temperature heat treatment in H 2 or NH 3 ,<br />
Vol. 17 No. 2 2000 55