Comprehensive Annual Financial Report June 30, 2011 - Western ...
Comprehensive Annual Financial Report June 30, 2011 - Western ...
Comprehensive Annual Financial Report June 30, 2011 - Western ...

Create successful ePaper yourself
Turn your PDF publications into a flip-book with our unique Google optimized e-Paper software.
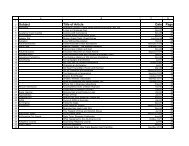
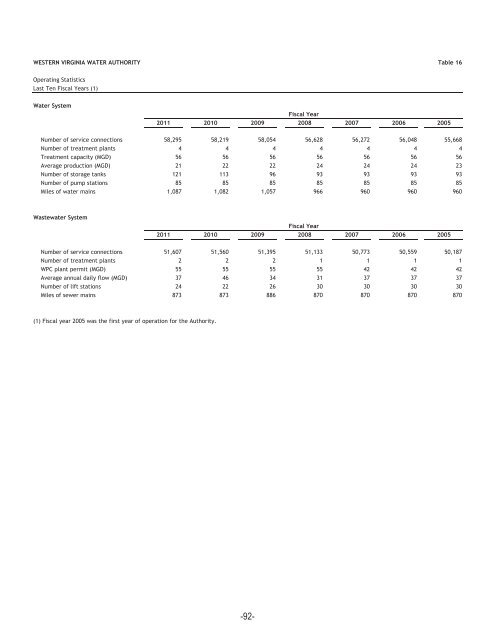
WESTERN VIRGINIA WATER AUTHORITY Table 16<br />
Operating Statistics<br />
Last Ten Fiscal Years (1)<br />
Water System<br />
Fiscal Year<br />
<strong>2011</strong> 2010 2009 2008 2007 2006 2005<br />
Number of service connections 58,295 58,219 58,054 56,628 56,272 56,048 55,668<br />
Number of treatment plants 4 4 4 4 4 4 4<br />
Treatment capacity (MGD) 56 56 56 56 56 56 56<br />
Average production (MGD) 21 22 22 24 24 24 23<br />
Number of storage tanks 121 113 96 93 93 93 93<br />
Number of pump stations 85 85 85 85 85 85 85<br />
Miles of water mains 1,087 1,082 1,057 966 960 960 960<br />
Wastewater System<br />
Fiscal Year<br />
<strong>2011</strong> 2010 2009 2008 2007 2006 2005<br />
Number of service connections 51,607 51,560 51,395 51,133 50,773 50,559 50,187<br />
Number of treatment plants 2 2 2 1 1 1 1<br />
WPC plant permit (MGD) 55 55 55 55 42 42 42<br />
Average annual daily flow (MGD) 37 46 34 31 37 37 37<br />
Number of lift stations 24 22 26 <strong>30</strong> <strong>30</strong> <strong>30</strong> <strong>30</strong><br />
Miles of sewer mains 873 873 886 870 870 870 870<br />
(1) Fiscal year 2005 was the first year of operation for the Authority.<br />
-92-