Comprehensive Annual Financial Report June 30, 2011 - Western ...
Comprehensive Annual Financial Report June 30, 2011 - Western ...
Comprehensive Annual Financial Report June 30, 2011 - Western ...

You also want an ePaper? Increase the reach of your titles
YUMPU automatically turns print PDFs into web optimized ePapers that Google loves.
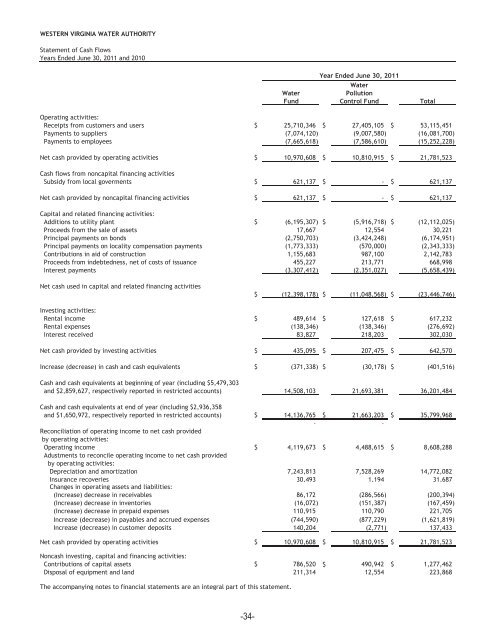
WESTERN VIRGINIA WATER AUTHORITY<br />
Statement of Cash Flows<br />
Years Ended <strong>June</strong> <strong>30</strong>, <strong>2011</strong> and 2010<br />
Year Ended <strong>June</strong> <strong>30</strong>, <strong>2011</strong><br />
Water<br />
Water<br />
Pollution<br />
Fund Control Fund Total<br />
Operating activities:<br />
Receipts from customers and users $ 25,710,346 $ 27,405,105 $ 53,115,451<br />
Payments to suppliers (7,074,120) (9,007,580) (16,081,700)<br />
Payments to employees (7,665,618) (7,586,610) (15,252,228)<br />
Net cash provided by operating activities $ 10,970,608 $ 10,810,915 $ 21,781,523<br />
Cash flows from noncapital financing activities<br />
Subsidy from local goverments $ 621,137 $ - $ 621,137<br />
Net cash provided by noncapital financing activities $ 621,137 $ - $ 621,137<br />
Capital and related financing activities:<br />
Additions to utility plant $ (6,195,<strong>30</strong>7) $ (5,916,718) $ (12,112,025)<br />
Proceeds from the sale of assets 17,667 12,554 <strong>30</strong>,221<br />
Principal payments on bonds (2,750,703) (3,424,248) (6,174,951)<br />
Principal payments on locality compensation payments (1,773,333) (570,000) (2,343,333)<br />
Contributions in aid of construction 1,155,683 987,100 2,142,783<br />
Proceeds from indebtedness, net of costs of issuance 455,227 213,771 668,998<br />
Interest payments (3,<strong>30</strong>7,412) (2,351,027) (5,658,439)<br />
Net cash used in capital and related financing activities<br />
$ (12,398,178) $ (11,048,568) $ (23,446,746)<br />
Investing activities:<br />
Rental income $ 489,614 $ 127,618 $ 617,232<br />
Rental expenses (138,346) (138,346) (276,692)<br />
Interest received 83,827 218,203 <strong>30</strong>2,0<strong>30</strong><br />
Net cash provided by investing activities $ 435,095 $ 207,475 $ 642,570<br />
Increase (decrease) in cash and cash equivalents $ (371,338) $ (<strong>30</strong>,178) $ (401,516)<br />
Cash and cash equivalents at beginning of year (including $5,479,<strong>30</strong>3<br />
and $2,859,627, respectively reported in restricted accounts) 14,508,103 21,693,381 36,201,484<br />
Cash and cash equivalents at end of year (including $2,936,358<br />
and $1,650,972, respectively reported in restricted accounts) $ 14,136,765 $ 21,663,203 $ 35,799,968<br />
- -<br />
Reconciliation of operating income to net cash provided<br />
by operating activities:<br />
Operating income $ 4,119,673 $ 4,488,615 $ 8,608,288<br />
Adustments to reconcile operating income to net cash provided<br />
by operating activities:<br />
Depreciation and amortization 7,243,813 7,528,269 14,772,082<br />
Insurance recoveries <strong>30</strong>,493 1,194 31,687<br />
Changes in operating assets and liabilities:<br />
(Increase) decrease in receivables 86,172 (286,566) (200,394)<br />
(Increase) decrease in inventories (16,072) (151,387) (167,459)<br />
(Increase) decrease in prepaid expenses 110,915 110,790 221,705<br />
Increase (decrease) in payables and accrued expenses (744,590) (877,229) (1,621,819)<br />
Increase (decrease) in customer deposits 140,204 (2,771) 137,433<br />
Net cash provided by operating activities $ 10,970,608 $ 10,810,915 $ 21,781,523<br />
Noncash investing, capital and financing activities:<br />
Contributions of capital assets $ 786,520 $ 490,942 $ 1,277,462<br />
Disposal of equipment and land 211,314 12,554 223,868<br />
The accompanying notes to financial statements are an integral part of this statement.<br />
-34-