Comprehensive Annual Financial Report June 30, 2011 - Western ...
Comprehensive Annual Financial Report June 30, 2011 - Western ...
Comprehensive Annual Financial Report June 30, 2011 - Western ...

Create successful ePaper yourself
Turn your PDF publications into a flip-book with our unique Google optimized e-Paper software.
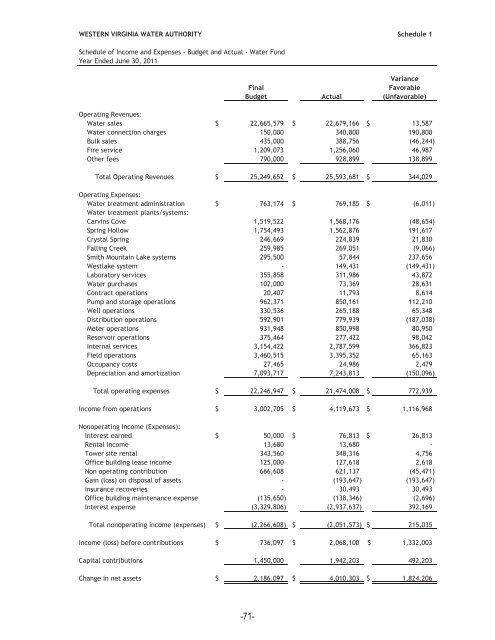
WESTERN VIRGINIA WATER AUTHORITY Schedule 1<br />
Schedule of Income and Expenses - Budget and Actual - Water Fund<br />
Year Ended <strong>June</strong> <strong>30</strong>, <strong>2011</strong><br />
Variance<br />
Final<br />
Favorable<br />
Budget Actual (Unfavorable)<br />
Operating Revenues:<br />
Water sales $ 22,665,579 $ 22,679,166 $ 13,587<br />
Water connection charges 150,000 340,800 190,800<br />
Bulk sales 435,000 388,756 (46,244)<br />
Fire service 1,209,073 1,256,060 46,987<br />
Other fees 790,000 928,899 138,899<br />
Total Operating Revenues $ 25,249,652 $ 25,593,681 $ 344,029<br />
Operating Expenses:<br />
Water treatment administration $ 763,174 $ 769,185 $ (6,011)<br />
Water treatment plants/systems:<br />
Carvins Cove 1,519,522 1,568,176 (48,654)<br />
Spring Hollow 1,754,493 1,562,876 191,617<br />
Crystal Spring 246,669 224,839 21,8<strong>30</strong><br />
Falling Creek 259,985 269,051 (9,066)<br />
Smith Mountain Lake systems 295,500 57,844 237,656<br />
Westlake system - 149,431 (149,431)<br />
Laboratory services 355,858 311,986 43,872<br />
Water purchases 102,000 73,369 28,631<br />
Contract operations 20,407 11,793 8,614<br />
Pump and storage operations 962,371 850,161 112,210<br />
Well operations 3<strong>30</strong>,536 265,188 65,348<br />
Distribution operations 592,901 779,939 (187,038)<br />
Meter operations 931,948 850,998 80,950<br />
Reservoir operations 375,464 277,422 98,042<br />
Internal services 3,154,422 2,787,599 366,823<br />
Field operations 3,460,515 3,395,352 65,163<br />
Occupancy costs 27,465 24,986 2,479<br />
Depreciation and amortization 7,093,717 7,243,813 (150,096)<br />
Total operating expenses $ 22,246,947 $ 21,474,008 $ 772,939<br />
Income from operations $ 3,002,705 $ 4,119,673 $ 1,116,968<br />
Nonoperating Income (Expenses):<br />
Interest earned $ 50,000 $ 76,813 $ 26,813<br />
Rental income 13,680 13,680 -<br />
Tower site rental 343,560 348,316 4,756<br />
Office building lease income 125,000 127,618 2,618<br />
Non operating contribution 666,608 621,137 (45,471)<br />
Gain (loss) on disposal of assets - (193,647) (193,647)<br />
Insurance recoveries - <strong>30</strong>,493 <strong>30</strong>,493<br />
Office building maintenance expense (135,650) (138,346) (2,696)<br />
Interest expense (3,329,806) (2,937,637) 392,169<br />
Total nonoperating income (expenses) $ (2,266,608) $ (2,051,573) $ 215,035<br />
Income (loss) before contributions $ 736,097 $ 2,068,100 $ 1,332,003<br />
Capital contributions 1,450,000 1,942,203 492,203<br />
Change in net assets $ 2,186,097 $ 4,010,<strong>30</strong>3 $ 1,824,206<br />
-71-