Comprehensive Annual Financial Report June 30, 2011 - Western ...
Comprehensive Annual Financial Report June 30, 2011 - Western ...
Comprehensive Annual Financial Report June 30, 2011 - Western ...

You also want an ePaper? Increase the reach of your titles
YUMPU automatically turns print PDFs into web optimized ePapers that Google loves.
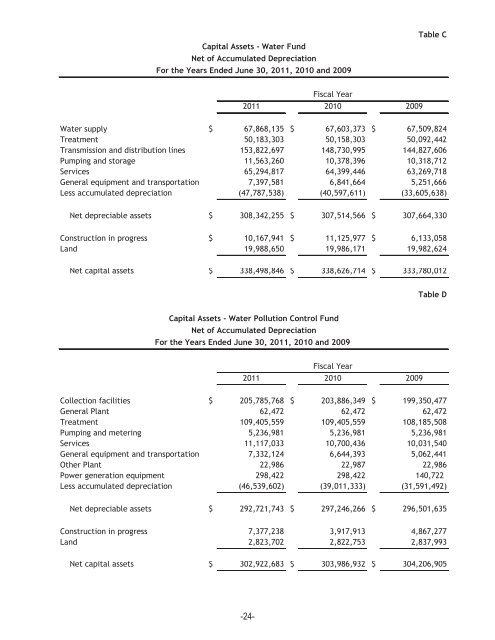
Capital Assets - Water Fund<br />
Net of Accumulated Depreciation<br />
For the Years Ended <strong>June</strong> <strong>30</strong>, <strong>2011</strong>, 2010 and 2009<br />
Table C<br />
Fiscal Year<br />
<strong>2011</strong> 2010 2009<br />
Water supply $ 67,868,135 $ 67,603,373 $ 67,509,824<br />
Treatment 50,183,<strong>30</strong>3 50,158,<strong>30</strong>3 50,092,442<br />
Transmission and distribution lines 153,822,697 148,7<strong>30</strong>,995 144,827,606<br />
Pumping and storage 11,563,260 10,378,396 10,318,712<br />
Services 65,294,817 64,399,446 63,269,718<br />
General equipment and transportation 7,397,581 6,841,664 5,251,666<br />
Less accumulated depreciation (47,787,538) (40,597,611) (33,605,638)<br />
Net depreciable assets $ <strong>30</strong>8,342,255 $ <strong>30</strong>7,514,566 $ <strong>30</strong>7,664,3<strong>30</strong><br />
Construction in progress $ 10,167,941 $ 11,125,977 $ 6,133,058<br />
Land 19,988,650 19,986,171 19,982,624<br />
Net capital assets $ 338,498,846 $ 338,626,714 $ 333,780,012<br />
Table D<br />
Capital Assets - Water Pollution Control Fund<br />
Net of Accumulated Depreciation<br />
For the Years Ended <strong>June</strong> <strong>30</strong>, <strong>2011</strong>, 2010 and 2009<br />
Fiscal Year<br />
<strong>2011</strong> 2010 2009<br />
Collection facilities $ 205,785,768 $ 203,886,349 $ 199,350,477<br />
General Plant 62,472 62,472 62,472<br />
Treatment 109,405,559 109,405,559 108,185,508<br />
Pumping and metering 5,236,981 5,236,981 5,236,981<br />
Services 11,117,033 10,700,436 10,031,540<br />
General equipment and transportation 7,332,124 6,644,393 5,062,441<br />
Other Plant 22,986 22,987 22,986<br />
Power generation equipment 298,422 298,422 140,722<br />
Less accumulated depreciation (46,539,602) (39,011,333) (31,591,492)<br />
Net depreciable assets $ 292,721,743 $ 297,246,266 $ 296,501,635<br />
Construction in progress 7,377,238 3,917,913 4,867,277<br />
Land 2,823,702 2,822,753 2,837,993<br />
Net capital assets $ <strong>30</strong>2,922,683 $ <strong>30</strong>3,986,932 $ <strong>30</strong>4,206,905<br />
-24-