Comprehensive Annual Financial Report June 30, 2011 - Western ...
Comprehensive Annual Financial Report June 30, 2011 - Western ...
Comprehensive Annual Financial Report June 30, 2011 - Western ...

Create successful ePaper yourself
Turn your PDF publications into a flip-book with our unique Google optimized e-Paper software.
<strong>Financial</strong> Analysis (Continued)<br />
Total long-term liabilities to net capital assets are 20.7% for the Water fund and 22.2% for the WPC fund at<br />
<strong>June</strong> <strong>30</strong>, <strong>2011</strong>. The percentage decreased from 2010 for both funds, indicating that total capital assets are<br />
increasing faster than total long term liabilities. The percentage decreased from 2010 for the funds as a<br />
result of continued bond payments reducing outstanding debt. This ratio shows the existing debt leverage of<br />
capital assets and indicates that the Authority is not heavily leveraged relative to the size of its net capital<br />
assets.<br />
Total long-term outstanding liabilities to net capital assets are 21.9% for the Water fund and 23.3% for the<br />
WPC fund at <strong>June</strong> <strong>30</strong>, 2010. The percentage decreased from 2009 for both funds, indicating that total<br />
capital assets are increasing faster than total long term liabilities. The percentage decreased from 2009 for<br />
both funds as a result of continued bond payments reducing outstanding debt.<br />
The current ratio for the Water fund for the years ended <strong>June</strong> <strong>30</strong>, <strong>2011</strong>, 2010 and 2009 was 1.64, 1.34, and<br />
1.49, respectively. The current ratio for the WPC fund for the years ended <strong>June</strong> <strong>30</strong>, <strong>2011</strong>, 2010 and 2009<br />
was 3.59, 3.01, and 2.86, respectively. The combined funds have a current ratio for the years ended <strong>June</strong><br />
<strong>30</strong>, <strong>2011</strong>, 2010 and 2009 of 2.49, 2.10, and 2.12, respectively. The current ratio compares current assets to<br />
current liabilities. This ratio is a liquidity ratio and shows the ability of the company to pay its current<br />
liabilities with its current assets.<br />
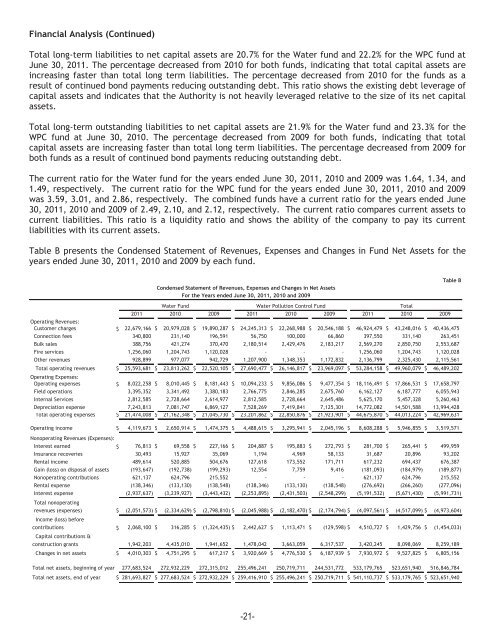
Table B presents the Condensed Statement of Revenues, Expenses and Changes in Fund Net Assets for the<br />
years ended <strong>June</strong> <strong>30</strong>, <strong>2011</strong>, 2010 and 2009 by each fund.<br />
Condensed Statement of Revenues, Expenses and Changes in Net Assets<br />
For the Years ended <strong>June</strong> <strong>30</strong>, <strong>2011</strong>, 2010 and 2009<br />
Table B<br />
Water Fund<br />
Water Pollution Control Fund<br />
<strong>2011</strong> 2010 2009 <strong>2011</strong> 2010 2009 <strong>2011</strong> 2010 2009<br />
Operating Revenues:<br />
Customer charges $ 22,679,166 $ 20,979,028 $ 19,890,287 $ 24,245,313 $ 22,268,988 $ 20,546,188 $ 46,924,479 $ 43,248,016 $ 40,436,475<br />
Connection fees 340,800 231,140 196,591 56,750 100,000 66,860 397,550 331,140 263,451<br />
Bulk sales 388,756 421,274 370,470 2,180,514 2,429,476 2,183,217 2,569,270 2,850,750 2,553,687<br />
Fire services 1,256,060 1,204,743 1,120,028 - - - 1,256,060 1,204,743 1,120,028<br />
Other revenues 928,899 977,077 942,729 1,207,900 1,348,353 1,172,832 2,136,799 2,325,4<strong>30</strong> 2,115,561<br />
Total operating revenues $ 25,593,681 $ 23,813,262 $ 22,520,105 $ 27,690,477 $ 26,146,817 $ 23,969,097 $ 53,284,158 $ 49,960,079 $ 46,489,202<br />
Operating Expenses:<br />
Operating expenses $ 8,022,258 $ 8,010,445 $ 8,181,443 $ 10,094,233 $ 9,856,086 $ 9,477,354 $ 18,116,491 $ 17,866,531 $ 17,658,797<br />
Field operations 3,395,352 3,341,492 3,380,183 2,766,775 2,846,285 2,675,760 6,162,127 6,187,777 6,055,943<br />
Internal Services 2,812,585 2,728,664 2,614,977 2,812,585 2,728,664 2,645,486 5,625,170 5,457,328 5,260,463<br />
Depreciation expense 7,243,813 7,081,747 6,869,127 7,528,269 7,419,841 7,125,<strong>30</strong>1 14,772,082 14,501,588 13,994,428<br />
Total operating expenses $ 21,474,008 $ 21,162,348 $ 21,045,7<strong>30</strong> $ 23,201,862 $ 22,850,876 $ 21,923,901 $ 44,675,870 $ 44,013,224 $ 42,969,631<br />
Operating income $ 4,119,673 $ 2,650,914 $ 1,474,375 $ 4,488,615 $ 3,295,941 $ 2,045,196 $ 8,608,288 $ 5,946,855 $ 3,519,571<br />
Nonoperating Revenues (Expenses):<br />
Interest earned $ 76,813 $ 69,558 $ 227,166 $ 204,887 $ 195,883 $ 272,793 $ 281,700 $ 265,441 $ 499,959<br />
Insurance recoveries <strong>30</strong>,493 15,927 35,069 1,194 4,969 58,133 31,687 20,896 93,202<br />
Rental income 489,614 520,885 504,676 127,618 173,552 171,711 617,232 694,437 676,387<br />
Gain (loss) on disposal of assets (193,647) (192,738) (199,293) 12,554 7,759 9,416 (181,093) (184,979) (189,877)<br />
Nonoperating contributions 621,137 624,796 215,552 - - - 621,137 624,796 215,552<br />
Rental expense (138,346) (133,1<strong>30</strong>) (138,548) (138,346) (133,1<strong>30</strong>) (138,548) (276,692) (266,260) (277,096)<br />
Interest expense (2,937,637) (3,239,927) (3,443,432) (2,253,895) (2,431,503) (2,548,299) (5,191,532) (5,671,4<strong>30</strong>) (5,991,731)<br />
Total nonoperating<br />
revenues (expenses) $ (2,051,573) $ (2,334,629) $ (2,798,810) $ (2,045,988) $ (2,182,470) $ (2,174,794) $ (4,097,561) $ (4,517,099) $ (4,973,604)<br />
Income (loss) before<br />
contributions $ 2,068,100 $ 316,285 $ (1,324,435) $ 2,442,627 $ 1,113,471 $ (129,598) $ 4,510,727 $ 1,429,756 $ (1,454,033)<br />
Capital contributions &<br />
construction grants 1,942,203 4,435,010 1,941,652 1,478,042 3,663,059 6,317,537 3,420,245 8,098,069 8,259,189<br />
Changes in net assets $ 4,010,<strong>30</strong>3 $ 4,751,295 $ 617,217 $ 3,920,669 $ 4,776,5<strong>30</strong> $ 6,187,939 $ 7,9<strong>30</strong>,972 $ 9,527,825 $ 6,805,156<br />
Total<br />
Total net assets, beginning of year 277,683,524 272,932,229 272,315,012 255,496,241 250,719,711 244,531,772 533,179,765 523,651,940 516,846,784<br />
Total net assets, end of year $ 281,693,827 $ 277,683,524 $ 272,932,229 $ 259,416,910 $ 255,496,241 $ 250,719,711 $ 541,110,737 $ 533,179,765 $ 523,651,940<br />
-21-