Final SACOG Phase 1 Goods Movement Report
Final SACOG Phase 1 Goods Movement Report
Final SACOG Phase 1 Goods Movement Report

Create successful ePaper yourself
Turn your PDF publications into a flip-book with our unique Google optimized e-Paper software.
half the decline was due to reductions in imports of electronic components and accessories from<br />
Japan through California. At the same time, Savannah and New York experienced significant increases<br />
in imports of these same products. Similarly, a decline in imports of integrated circuits<br />
through California’s airports occured during this time. This was coincident with a dramatic increase,<br />
equal to about half of the California decline, in their flow into the Savannah airport. Similar<br />
changes occurred in computer and office equipment trade with Japan. In particular, imports of<br />
hard drives and laptops have shifted dramaticaly from California’s airports to those in Chicago<br />
and New York.<br />
On the export side, the reduction in demand shares for California airport services largely reflects<br />
a change in the export origin point for integrated circuits bound for the Philippines, Malaysia,<br />
Singapore, and Japan. Many high-tech exports now originate in Dallas, Boston, and New York<br />
rather than California.<br />
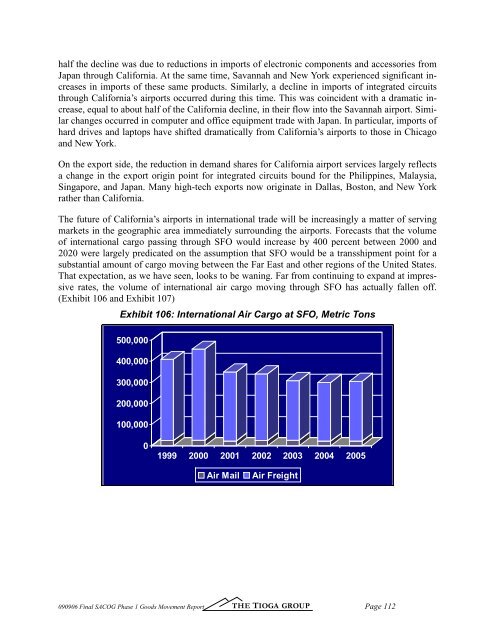
The future of California’s airports in international trade wil be increasingly a mater of serving<br />
markets in the geographic area immediately surrounding the airports. Forecasts that the volume<br />
of international cargo passing through SFO would increase by 400 percent between 2000 and<br />
2020 were largely predicated on the assumption that SFO would be a transshipment point for a<br />
substantial amount of cargo moving between the Far East and other regions of the United States.<br />
That expectation, as we have seen, looks to be waning. Far from continuing to expand at impressive<br />
rates, the volume of international air cargo moving through SFO has actually fallen off.<br />
(Exhibit 106 and Exhibit 107)<br />
Exhibit 106: International Air Cargo at SFO, Metric Tons<br />
500,000<br />
400,000<br />
300,000<br />
200,000<br />
100,000<br />
0<br />
1999 2000 2001 2002 2003 2004 2005<br />
Air Mail<br />
Air Freight<br />
090906 <strong>Final</strong> <strong>SACOG</strong> <strong>Phase</strong> 1 <strong>Goods</strong> <strong>Movement</strong> <strong>Report</strong> THE TIOGA GROUP<br />
Page 112