Final SACOG Phase 1 Goods Movement Report
Final SACOG Phase 1 Goods Movement Report
Final SACOG Phase 1 Goods Movement Report

Create successful ePaper yourself
Turn your PDF publications into a flip-book with our unique Google optimized e-Paper software.
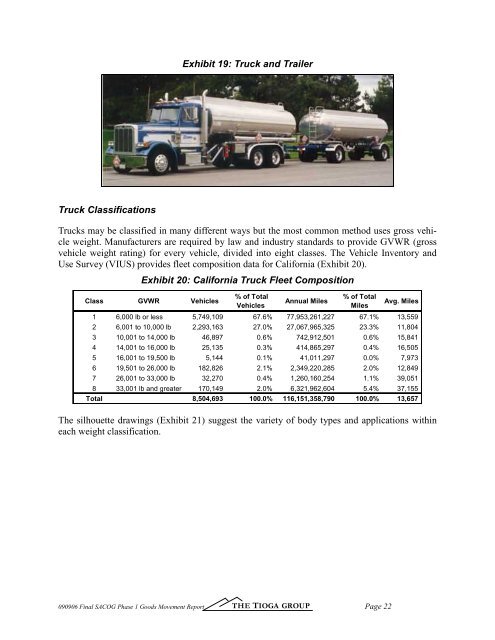
Exhibit 19: Truck and Trailer<br />
Truck Classifications<br />
Trucks may be classified in many different ways but the most common method uses gross vehicle<br />
weight. Manufacturers are required by law and industry standards to provide GVWR (gross<br />
vehicle weight rating) for every vehicle, divided into eight classes. The Vehicle Inventory and<br />
Use Survey (VIUS) provides fleet composition data for California (Exhibit 20).<br />
Exhibit 20: California Truck Fleet Composition<br />
Class GVWR Vehicles<br />
% of Total<br />
Vehicles<br />
Annual Miles<br />
% of Total<br />
Miles<br />
Avg. Miles<br />
1 6,000 lb or less 5,749,109 67.6% 77,953,261,227 67.1% 13,559<br />
2 6,001 to 10,000 lb 2,293,163 27.0% 27,067,965,325 23.3% 11,804<br />
3 10,001 to 14,000 lb 46,897 0.6% 742,912,501 0.6% 15,841<br />
4 14,001 to 16,000 lb 25,135 0.3% 414,865,297 0.4% 16,505<br />
5 16,001 to 19,500 lb 5,144 0.1% 41,011,297 0.0% 7,973<br />
6 19,501 to 26,000 lb 182,826 2.1% 2,349,220,285 2.0% 12,849<br />
7 26,001 to 33,000 lb 32,270 0.4% 1,260,160,254 1.1% 39,051<br />
8 33,001 lb and greater 170,149 2.0% 6,321,962,604 5.4% 37,155<br />
Total 8,504,693 100.0% 116,151,358,790 100.0% 13,657<br />
Source: Vehicle Inventory and User Survey Data (VIUS), U.S. Census Bureau<br />
The silhouette drawings (Exhibit 21) suggest the variety of body types and applications within<br />
each weight classification.<br />
090906 <strong>Final</strong> <strong>SACOG</strong> <strong>Phase</strong> 1 <strong>Goods</strong> <strong>Movement</strong> <strong>Report</strong> THE TIOGA GROUP<br />
Page 22