MS20 Laboratory: Physical and Biological Factors Affecting Oxygen ...
MS20 Laboratory: Physical and Biological Factors Affecting Oxygen ...
MS20 Laboratory: Physical and Biological Factors Affecting Oxygen ...

Create successful ePaper yourself
Turn your PDF publications into a flip-book with our unique Google optimized e-Paper software.
<strong>MS20</strong> <strong>Laboratory</strong>: <strong>Physical</strong> <strong>and</strong> <strong>Biological</strong> <strong>Factors</strong> <strong>Affecting</strong><br />
<strong>Oxygen</strong> in Sea Water<br />
Objectives<br />
• Underst<strong>and</strong> the relationship between oxygen concentration <strong>and</strong> temperature<br />
• Underst<strong>and</strong> the relationship between oxygen concentration <strong>and</strong> salinity<br />
• Use The Winkler titration method to determine oxygen concentration in a water sample<br />
• Investigate the relationship of latitude <strong>and</strong> longitude on oxygen concentration<br />
• Investigate the effect of de[p[th on oxygen concentration<br />
Introduction<br />
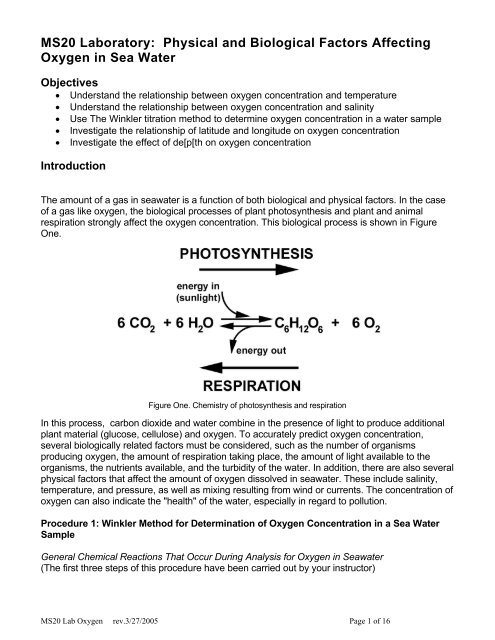
The amount of a gas in seawater is a function of both biological <strong>and</strong> physical factors. In the case<br />
of a gas like oxygen, the biological processes of plant photosynthesis <strong>and</strong> plant <strong>and</strong> animal<br />
respiration strongly affect the oxygen concentration. This biological process is shown in Figure<br />
One.<br />
Figure One. Chemistry of photosynthesis <strong>and</strong> respiration<br />
In this process, carbon dioxide <strong>and</strong> water combine in the presence of light to produce additional<br />
plant material (glucose, cellulose) <strong>and</strong> oxygen. To accurately predict oxygen concentration,<br />
several biologically related factors must be considered, such as the number of organisms<br />
producing oxygen, the amount of respiration taking place, the amount of light available to the<br />
organisms, the nutrients available, <strong>and</strong> the turbidity of the water. In addition, there are also several<br />
physical factors that affect the amount of oxygen dissolved in seawater. These include salinity,<br />
temperature, <strong>and</strong> pressure, as well as mixing resulting from wind or currents. The concentration of<br />
oxygen can also indicate the "health" of the water, especially in regard to pollution.<br />
Procedure 1: Winkler Method for Determination of <strong>Oxygen</strong> Concentration in a Sea Water<br />
Sample<br />
General Chemical Reactions That Occur During Analysis for <strong>Oxygen</strong> in Seawater<br />
(The first three steps of this procedure have been carried out by your instructor)<br />
<strong>MS20</strong> Lab <strong>Oxygen</strong> rev.3/27/2005 Page 1 of 16
1. To a carefully collected se water sample, add a manganous sulfate solution <strong>and</strong> a alkaline<br />
potassium hydroxide-iodide solution to the seawater. This forms manganous hydroxide-which is a<br />
precipitate.<br />
2. The newly formed manganous hydroxide Mn(OH) 2 reacts with the dissolved oxygen in the<br />
seawater to form a hydrated tetravalent oxide of manganese.<br />
3. Next add sulfuric acid to the solution in the presence of iodide to release free iodine.<br />
4. The free iodine released from this reaction is equivalent to the dissolved oxygen present in the<br />
seawater. In the presence of a starch solution this free iodine has an intense blue color.<br />
5. Using the titration method, determine the amount of I 2 present (<strong>and</strong> therefore the oxygen<br />
content) by adding a st<strong>and</strong>ardized sodium thiosulfate solution until the blue color disappears. This<br />
takes place when all the free iodine is gone.<br />
Sampling for <strong>Oxygen</strong> Analysis<br />
Because this experiment requires that the samples react with the chemical solution for a given<br />
period of time, all the samples will be collected <strong>and</strong> chemically “fixed” collections by the instructor<br />
before the lab period begins. The following samples have been collected (see Figure Two). The<br />
model lake samples are collected from the surface first, then sequentially down into the "lake".<br />
1. 0 o / oo salinity, room temperature aquarium (st<strong>and</strong>ard)<br />
2. 35 o / oo salinity, room temperature aquarium<br />
3. 0 o / oo salinity, polluted room temperature aquarium<br />
4. Model lake-surface<br />
5. Model lake-75 cm down<br />
6. Model lake-near bottom<br />
Figure Two. Water sampling procedure<br />
<strong>MS20</strong> Lab <strong>Oxygen</strong> rev.3/27/2005 Page 2 of 16
The water samples have been collected <strong>and</strong> the oxygen “fixed” in the following manner:<br />
1. Each BOD (biological oxygen dem<strong>and</strong>) bottle was filled right to the brim with the water sample.<br />
BOD bottles (as shown in Figure Three, step 1) were filled with the rubber tubing resting on the<br />
bottom of the bottle so that "extra" oxygen was not added by splashing or agitation.<br />
2. Using the automatic pipettes, 1 ml of prepared manganous sulfate solution (step 2) was<br />
added to each BOD bottle followed immediately by 1 ml of the alkaline potassium iodide<br />
solution (step 3). After adding the potassium iodide solution, the water in most of the BOD bottles<br />
turns a straw yellow. However, those samples with little or no oxygen (polluted environment <strong>and</strong><br />
lake bottom) will have a very weak yellow color or even a pale gray.<br />
3. The bottles were stoppered then shaken (step 4); the contents were allowed to settle for 15<br />
minutes, <strong>and</strong> then the bottles were shaken again.<br />
4. To each bottle 1 ml of concentrated sulfuric acid (step 5) was added. The bottles were restoppered<br />
<strong>and</strong> shaken until the precipitate dissolved. The solution turns slightly darker.<br />
5. The sample has now been "fixed" <strong>and</strong> can be analyzed any time during the lab period. The<br />
"fixing" process means that free iodine has been released in exact proportion to the oxygen that<br />
was in the sample at the time of “fixing”. The addition of oxygen to the sample after “fixing” will not<br />
affect the amount of free iodine now in the sample <strong>and</strong> so will not alter the titration results.<br />
Figure Three. <strong>Oxygen</strong> analysis flow chart<br />
<strong>MS20</strong> Lab <strong>Oxygen</strong> rev.3/27/2005 Page 3 of 16
St<strong>and</strong>ardizing the Thiosulfate Solution<br />
If we know the oxygen content of a given water sample, we can use this as our st<strong>and</strong>ard <strong>and</strong><br />
calibrate the thiosulfate solution to it. This assumes, of course, that we know the exact condition of<br />
our water sample, its salinity, temperature, <strong>and</strong> degree of oxygen saturation. If we use aerated<br />
fresh water at room temperature, we can closely approximate the actual oxygen content of the<br />
water by consulting the proper oceanographic tables.<br />
Table One shows the theoretical saturations of oxygen at 0 o / oo salinity <strong>and</strong> at the temperature<br />
ranges typically encountered in nature.<br />
Table One. Theoretical <strong>Oxygen</strong> Saturation at Various Temperatures<br />
TEMPERATURE 0 2 TEMPERATURE 0 2 TEMPERATURE 0 2<br />
(ºC) mL/L (ºC) mL/L (ºC) mL/L<br />
0 10.22 9 8.07 18 6.61<br />
1 9.94 10 7.88 19 6.48<br />
2 9.66 11 7.71 20 6.36<br />
3 9.39 12 7.54 21 6.23<br />
4 9.14 13 7.37 22 6.11<br />
5 8.90 14 7.21 23 6.00<br />
6 8.68 15 7.05 24 5.89<br />
7 8.47 16 6.90 25 5.77<br />
8 8.27 17 6.75<br />
Sample 1, from the open aquarium at 0 o / oo salinity, will represent your st<strong>and</strong>ard. In order to<br />
calibrate your thiosulfate solution, you will need to know how many milliliters of thiosulfate are<br />
needed to titrate the st<strong>and</strong>ard.<br />
Procedure<br />
1. Transfer exactly 50 mLof the known sample into a 125 mLErlenmeyer flask, using a 50 mL<br />
volumetric flask for the transfer (Figure Three, steps 6 <strong>and</strong> 7).<br />
2. Fill a 50 mL buret with thiosulfate solution (step 8). Record the buret level in Table Two below.<br />
3. Add approximately 5 mL of the starch solution (step 9) to your sample in the flask. The solution<br />
in the flask becomes dark blue. Slowly titrate (add thiosulfate from the buret) until the solution<br />
becomes colorless (step 10). You might hold a sheet of white paper behind the flask to help<br />
determine when the solution becomes colorless. At this point, you may still observe a few blue<br />
particles- don't worry about them. You have reached the end point! Record the final amount in<br />
the buret in Table Two. After calculating the difference between the starting <strong>and</strong> ending points on<br />
the buret, you will know the number of milliliters of thiosulfate required to render the solution<br />
colorless.<br />
<strong>MS20</strong> Lab <strong>Oxygen</strong> rev.3/27/2005 Page 4 of 16
4. Calibrate the thiosulfate solution by noting the number of milliliters of solution required to titrate<br />
a st<strong>and</strong>ard volume (50 ml) of fresh water ( 0 o / oo ), room temperature.<br />
Run the st<strong>and</strong>ard twice, taking the second 50 mL aliquots from the same BOD bottle as you took<br />
the first. Average your results from the two runs. Find the theoretical oxygen content from Table<br />
One.<br />
For the remaining samples (the unknowns), complete steps 6 through 10 on Figure Three for<br />
each analysis. Titrate each unknown once, unless you miss the end point.<br />
To calculate the concentration of each unknown, you will use the following formula<br />
unknown O 2 concentration = known O 2 concentration x mL thiosulfate used for unknown / ml thiosulfate for known<br />
where the known O 2 concentration is the one you determined from the st<strong>and</strong>ard.<br />
Record your results on your answer sheet.<br />
Procedure 2. Dissolved <strong>Oxygen</strong> (DO) in the Sea: Oceanographic Data Tables<br />
The following tables contain actual hydrographic data taken by oceanographic vessels<br />
throughout the world’s oceans. Hydrocasts always include the temperature, salinity <strong>and</strong> depth.<br />
Dissolved oxygen <strong>and</strong> phosphate data are often included. The exact location of the hydrocast is<br />
given by the latitude <strong>and</strong> longitude.<br />
1. Mark on Map A all the stations given in the data tables.<br />
2. Graph dissolved oxygen versus depth.<br />
Answer the following questions.<br />
A. How do surface values compare from place to place?<br />
B. How does dissolved oxygen vary with depth per locale? From locale to locale?<br />
C. What factors affect oxygen concentration?<br />
D. Are there any subsurface maximums? Minimums? If so, explain what causes them.<br />
<strong>MS20</strong> Lab <strong>Oxygen</strong> rev.3/27/2005 Page 5 of 16
Charles H. Gilbert; August 21; 21º11’N, 158º18’W;wind 090º,14kt; weather, cloudy<br />
Depth (m) T (ºC) S (º/ ºº<br />
) O 2 (mL/L) PO 4 -P (µg-at/L) σ t (g/mL)<br />
0 26.15 34.96 4.79 0.20 22.98<br />
24 26.16 34.96 4.78 0.10 22.97<br />
50 25.70 35.01 4.87 0.10 23.16<br />
73 23.86 35.01 5.02 0.06 23.17<br />
99 22.00 35.12 5.04 0.12 24.33<br />
147 20.08 35.14 4.77 0.17 24.87<br />
200 17.22 34.74 4.63 0.43 25.28<br />
250 13.94 34.38 4.48 0.48 25.74<br />
274 11.27 34.16 4.23 0.51 26.09<br />
300 9.78 34.13 4.19 0.61 26.33<br />
Charles H. Gilbert; August 20; 21º09’N, 158º20’W; wind 030º,11kt; weather, cloudy<br />
Depth (m) T (ºC) S (º/ ºº<br />
) O 2 (mL/L) PO 4 -P (µg-at/L) σ t (g/mL)<br />
0 26.15 34.96 4.78 0.22 22.98<br />
23 26.09 34.96 4.82 0.17 23.00<br />
43 26.08 34.99 4.77 0.08 23.02<br />
63 25.48 34.99 4.84 0.03 23.21<br />
85 22.66 35.03 4.99 0.07 24.07<br />
122 21.30 35.12 4.98 0.05 24.52<br />
176 20.20 34.83 4.84 0.06 24.60<br />
219 17.68 34.58 4.48 0.40 25.05<br />
242 15.92 34.36 4.51 0.21 25.29<br />
265 14.85 35.07 4.54 0.28 26.08<br />
Hugh M. Smith; September 17; 21º14’N, 158º19’W; wind 050º, 8kt; weather, partly cloudy<br />
Depth (m) T (ºC) S (º/ ºº<br />
) O 2 (mL/L) PO 4 -P (µg-at/L) σ t (g/mL)<br />
0 26.07 35.07 0.13 23.09<br />
26 25.88 35.05 0.17 23.13<br />
51 25.50 35.10 0.12 23.28<br />
77 23.11 35.10 0.06 24.00<br />
105 21.50 35.10 0.12 24.45<br />
156 19.68 35.05 0.26 24.90<br />
208 17.10 34.74 4.32 0.36 25.31<br />
258 14.12 34.38 4.32 0.70 25.70<br />
284 13.08 34.33 4.00 0.90 25.88<br />
310 11.33 34.22 3.89 1.13 26.13<br />
409 8.26 34.18 2.44 0.86 26.61<br />
506 6.37 34.20 1.48 1.22 26.89<br />
605 5.67 34.34 1.36 1.21 27.09<br />
803 4.64 34.45 0.91 1.29 27.30<br />
1001 4.09 34.51 1.11 1.30 27.41<br />
1511 2.62 34.61 1.70 1.59 27.63<br />
2037 1.98 34.63 2.20 2.98 27.70<br />
2557 1.68 34.67 2.58 2.71 27.75<br />
2570 1.72 34.69 2.64 1.10 27.77<br />
<strong>MS20</strong> Lab <strong>Oxygen</strong> rev.3/27/2005 Page 6 of 16
Crawford; Station 441; 24º 16'S 07º 43'W; Date: 9/19<br />
Depth (m) T (ºC) S (º/ ºº<br />
) O 2 (mL/L) PO 4 -P (µg-at/L) Total P (µg-at/L)<br />
0 20.07 36.265 4.98 0.32 0.71<br />
50 19.59 36.194 5.14 0.35 0.56<br />
100 19.00 36.129 5.09 0.34 0.52<br />
195 15.18 35.474 4.81 0.50 0.79<br />
295 13.09 35.203 4.81 0.72 0.86<br />
390 11.09 34.938 4.53 1.13 1.25<br />
490 8.90 34.692 4.26 1.45 1.51<br />
590 6.74 34.488 4.25 1.83 1.89<br />
685 4.97 34.359 4.47 2.15 2.14<br />
785 4.22 34.354 4.30 2.17 2.29<br />
980 3.42 34.447 4.10 2.28 2.25<br />
1130 3.22 34.556 4.12 2.23 2.16<br />
1285 3.22 34.664 4.13 2.08 1.94<br />
1430 3.16 34.738 4.44 1.88 1.85<br />
1755 2.91 34.827 4.79 1.71 1.65<br />
2050 2.68 34.854 5.06 1.67 1.60<br />
2345 2.60 34.873 5.19 1.61 1.61<br />
2640 2.52 34.883 5.23 1.61 1.56<br />
2935 2.46 34.884 5.24 1.53 1.54<br />
3235 2.42 34.886 5.19 1.61 1.60<br />
3530 2.39 34.888 5.14 1.62 1.57<br />
3830 2.40 34.890 5.08 1.59 1.59<br />
4125 2.41 34.891 5.07 1.66 1.59<br />
4425 2.44 34.890 5.08 1.69 1.67<br />
4575 2.47 34.891 5.14 1.64 1.56<br />
<strong>MS20</strong> Lab <strong>Oxygen</strong> rev.3/27/2005 Page 7 of 16
Crawford; Station 440; 24º 16'S 09º 11'W; Date: 9/18<br />
Depth (m) T (ºC) S (º/ ºº<br />
) O 2 (mL/L) PO 4 -P (µg-at/L) Total P (µg-at/L)<br />
0 20.21 36.320 4.94 0.30 0.47<br />
50 19.75 36.303 5.02 0.41 0.41<br />
100 19.45 36.263 4.94 0.41 0.54<br />
200 15.26 35.489 4.81 0.45 0.72<br />
295 12.86 35.148 4.50 0.80 1.04<br />
395 10.74 34.889 4.36 1.16 1.28<br />
495 8.56 34.667 4.01 1.58 1.70<br />
595 6.66 34.484 4.13 1.85 1.93<br />
695 5.27 34.382 4.32 2.01 2.03<br />
790 4.34 34.356 4.32 2.17 2.12<br />
990 3.49 34.421 4.11 2.22 2.21<br />
1190 3.22 34.571 4.00 2.16 2.15<br />
1385 3.18 34.723 4.34 1.96 1.97<br />
1585 3.03 34.802 4.68 1.82 1.75<br />
1725 2.90 34.816 4.76 1.67 1.71<br />
1925 2.70 34.834 4.90 1.61 1.63<br />
2125 2.59 34.852 5.07 1.61 1.64<br />
2420 2.52 34.871 5.26 1.57 1.62<br />
2720 2.49 34.880 5.32 1.60 1.60<br />
3020 2.44 34.883 5.26 1.48 1.69?<br />
3315 2.40 34.882 5.29 1.46 1.48<br />
3615 2.39 34.887 5.18 1.56 1.59<br />
3915 2.40 34.888 5.15 1.67 1.65<br />
4215 2.44 34.889 5.11 1.76 1.77<br />
4515 2.47 34.889 5.14 1.79 1.80<br />
Thor; August 10, 41º32’N 29º24’E<br />
Depth (m) T (ºC) S (º/ ºº<br />
) σ t (g/mL) O 2 (mL/L) H 2 S (mL/L)<br />
0 24.1 17.59 10.56 5.14<br />
10 24.1 17.59 10.56 5.14<br />
25 12.73 18.22 13.54 7.40<br />
50 8.22 18.30 13.22 6.71<br />
75 7.44 18.69 14.62 5.51<br />
100 7.61 19.65 15.33 2.33<br />
150 8.31 20.75 16.12 0.17<br />
200 8.54 21.29 16.51 0.90<br />
300 8.68 21.71 16.82 2.34<br />
400 8.72 21.91 16.97 4.17<br />
600 8.76 22.16 17.16 4.96<br />
800 8.80 22.21 17.19 6.06<br />
1000 8.85 22.27 17.24 6.04<br />
<strong>MS20</strong> Lab <strong>Oxygen</strong> rev.3/27/2005 Page 8 of 16
Horizon; November 23; 24º57’S 145º01’W; wind 180º, force 2; weather, missing; sea, slight.<br />
Depth (m) T (ºC) S (º/ ºº<br />
) O 2 (mL/L) PO 4 -P SiO 3 -Si pH<br />
(µg-at/L) (µg-at/L)<br />
σ t<br />
0 23.52 34.83 4.94 0.20 1 8.14 23.67<br />
8 23.53 34.88 4.95 0.12 2 8.35 23.71<br />
79 20.98 35.38 5.15 0.15 2 8.37 24.81<br />
157 19.58 35.36 5.03 0.23 0 8.30 25.16<br />
310 15.40 35.17 4.62 0.47 3 8.24 26.03<br />
462 10.87 34.71 4.64 1.06 4 8.16 26.59<br />
615 6.72 34.35 5.09 1.65 11 7.99 26.97<br />
766 5.58 34.29 5.23 1.78 17 8.00 27.07<br />
923 4.66 34.32 4.46 2.24 35 8.02 27.20<br />
1081 3.87 34.42 3.68 2.44 58 7.91 27.36<br />
1243 3.24 34.47 3.54 2.53 79 7.92 27.46<br />
1411 2.76 34.52 3.60 2.47 93 7.93 27.55<br />
1582 2.46 34.54 3.65 2.49 105 7.94 27.59<br />
1756 2.30 34.59 3.65 2.55 109 7.93 27.64<br />
1935 2.16 34.60 3.52 2.48 123 7.98 27.66<br />
2115 2.04 34.61 3.53 2.49 128 7.98 27.68<br />
2289 1.94 34.61 3.58 2.48 129 7.95 27.69<br />
2628 1.82 34.61 3.67 2.56 126 8.03 27.70<br />
2815 1.76 34.66 - 2.40 107u 8.08 27.74<br />
3013 1.70 34.64 3.79 2.54 130 8.04 27.73<br />
3212 1.64 34.63 3.94 2.55 134 8.04 27.72<br />
3608 1.54 34.65 4.05 2.42 130 8.06 27.75<br />
3806 1.52 34.67 4.15 2.45 132 8.07 27.77<br />
4006 1.52 34.68 4.16 2.47 131 8.05 27.77<br />
4205 1.52 34.68 4.17 2.49 130 8.07 27.77<br />
4406 1.50 34.69 4.30 2.48 129 8.10 27.78<br />
<strong>MS20</strong> Lab <strong>Oxygen</strong> rev.3/27/2005 Page 9 of 16
Atlantis Cruise 242; Station 5636; June 17; 19º01’N 39º21’E<br />
µg-at/L<br />
Depth (m) T (ºC) S (º/ ºº<br />
) O 2 (mL/L) PO 4 -P Total P<br />
1 30.49 38.04 3.92 0.18 0.46<br />
22 30.36 38.17 3.92 0.20 0.57<br />
44 29.13 38.49 4.08 0.18 0.62<br />
66 26.74 38.82 3.76 0.20 0.46<br />
87 25.41 39.45 3.34 0.23 0.71<br />
131 23.22 40.36 2.52 0.49 0.52<br />
175* 22.16 40.50 2.13 0.65 0.86<br />
262* 21.78 40.55 0.54 1.00 1.62<br />
350 21.69 40.57 1.08 0.95 1.36<br />
437 21.67 40.57 1.00 0.86 1.07<br />
Atlantis Cruise 242; Station 5637; June 17; 19º05’N 39º28’E<br />
µg-at/L<br />
Depth (m) T (ºC) S (º/ ºº<br />
) O 2 (mL/L) PO 4 -P Total P<br />
1 30.47 38.48 3.85 0.19 0.54<br />
25 30.23 38.43 3.91 0.21 0.40<br />
49 28.44 38.49 4.08 0.21 0.58<br />
74 26.29 39.04 3.85 0.19 0.55<br />
99 24.74 39.94 3.38 0.23 0.51<br />
148 22.43 40.50 2.80 0.44 0.81<br />
197* 21.93 40.53 0.79 0.93 1.33<br />
296 22.04? 40.54 0.37 1.14 1.40<br />
394 21.71 40.61 0.52 1.14 1.33<br />
493* 21.69 40.60 0.88 1.04 1.29<br />
399 21.76 40.59 0.48 --- ---<br />
597 21.69 40.57 1.16 0.84 ---<br />
794 21.69 40.61 1.73 0.65 1.00<br />
989 21.74 40.60 2.11 0.53 0.84<br />
1180* 21.88? 40.62 2.27 0.52 ---<br />
1359* 21.79 40.59 2.32 0.55 0.81<br />
1419 21.84 40.57 2.34 0.44 0.77<br />
1440 21.79 40.60 2.34 0.49 0.93<br />
1456 21.82 40.61 2.34 0.68 0.55<br />
1471* 21.83 40.61 2.30 0.72 0.79<br />
<strong>MS20</strong> Lab <strong>Oxygen</strong> rev.3/27/2005 Page 10 of 16
Atlantis Cruise 242; Station 5608; May 16; 25º21.9’N 36º07.9’E<br />
Depth (m) T (ºC) S (º/ ºº<br />
) O 2 (mL/L) PO 4 -P (µgat/L)<br />
Total P (µgat/L)<br />
3 25.44 39.83 4.06 --- 0.39<br />
25 25.14 39.90 4.09 --- 0.21<br />
71 22.15 40.35 4.07 --- 0.17<br />
116* 21.94 40.47 3.41 --- 0.40<br />
161 21.94 40.45 2.80 --- 0.49<br />
207* 21.81 40.47 2.22 --- 0.77<br />
78 22.97 40.36 3.96 --- 0.48<br />
158 21.95 40.48 2.75 --- 0.71<br />
238 21.72 40.55 1.60 --- 1.22<br />
567* 21.67 40.58 1.64 --- 1.51?<br />
910 21.71 40.58 2.22 --- 0.62<br />
1266 21.79 40.62 2.46 --- 0.56<br />
1636* 21.81 40.62 2.59 --- 0.58<br />
1730 21.84 40.62 2.55 --- 0.52<br />
1825* 21.84 40.57 2.54 --- 0.59<br />
1875 21.87 40.58 2.59 --- 0.59<br />
1923* 21.88 40.58 2.59 --- 0.61<br />
1971 21.86 40.58 2.60 --- 0.66<br />
1991 21.92 40.59 2.48 --- 0.62<br />
2008* 21.96 40.58 2.41 --- 0.64<br />
2019 --- 40.59 2.43 --- 0.60<br />
Atlantis Cruise 242; Station 5609; May28; 07º59.0’N 58º59.0’E<br />
µg-at/L<br />
Depth (m) T (ºC) S (º/ ºº<br />
) O 2 (mL/L) PO 4 -P Total P<br />
1 29.50 35.39 3.91 0.24 0.43<br />
10 29.49 35.40 3.91 0.39 0.35<br />
19 29.49 35.39 3.93 0.29 0.37<br />
48 28.98 35.44 4.08 0.27 0.44<br />
96 25.12 35.62 3.18 0.52 0.76<br />
144 19.20 35.40 1.54 1.18 1.16<br />
192* 16.37 35.34 1.05 1.07 1.30<br />
288 12.66 35.19 1.31 1.73? 1.60<br />
385 11.76 35.18 1.02 1.61 2.02<br />
578 10.41 35.26 0.53 1.88 2.33<br />
771 9.43 35.29 0.42 2.03 2.67<br />
966* 8.35 35.23 0.55 2.52? 2.67<br />
1162 6.66 35.06 0.89 2.09 2.78<br />
1455* 4.87 34.91 1.43 1.96 2.41<br />
1582* 4.14 34.80 1.74 --- ---<br />
1978 2.83 34.75 2.43 1.62 2.28<br />
2374* 2.19 34.75 2.84 --- 2.27<br />
2769 1.88 34.75 3.02 1.91 2.48<br />
3020 --- --- --- --- ---<br />
<strong>MS20</strong> Lab <strong>Oxygen</strong> rev.3/27/2005 Page 11 of 16
R/V Anton Bruun; Station 80; 15º43’N 90º<br />
µg-at/L<br />
Depth (m) T (ºC) S (º/ ºº<br />
) O 2 (mL/L) PO 4 -P NO 3 -N NO 2 -N SiO 3 -Si<br />
1 29.37 32.469 4.63 0.06 u 0.02 17.3<br />
25 27.33 32.974 4.79 0.15 0.5 0.04 10.2<br />
50 26.09 33.282 4.73 0.17 u 0.02 8.8<br />
75 25.96 33.858 3.95 0.33 1.1 0.21 0.4<br />
100 22.94 34.624 0.61 1.72 17.9 0.06 13.3<br />
125 19.35 34.752 0.28 2.08 24.0 0.08 26.4<br />
149 16.75 34.881 0.15 2.33 25.5 0.06 26.9<br />
199 13.91 34.955 0.24 2.55 29.6 0.01 32.9<br />
299 11.45 35.022 0.33 2.69 30.6 0.03 39.9<br />
398 10.47 35.027 0.40 2.83 32.0 0.04 44.2<br />
498 9.76 35.017 0.36 2.91 32.0 0.05 53.6<br />
598 8.99 35.012 0.46 2.97 30.3 0.03 60.6<br />
697 8.36 34.996 0.51 3.04 31.9 0.04 69.8<br />
797 7.72 34.978 0.64 3.14 33.5 0.07 75.8<br />
896 7.09 34.952 0.81 3.16 34.0 0.03 82.9<br />
996 6.55 34.939 0.96 3.22 34.1 0.03 89.7<br />
995 6.62 34.943 0.90 3.22 33.5 0.02 89.4<br />
1195 5.64 34.901 1.33 3.19 33.6 0.02 101<br />
1496 4.40 34.858 1.82 3.14 32.3 0.03 116<br />
1780 3.20 34.804 2.53 3.14 35.7 0.04 132<br />
2073 2.56 34.766 2.97 3.08 35.8 0.03 136<br />
2371 2.20 34.762 3.18 3.03 34.7 0.03 140<br />
R/V Anton Bruun; Station 80; 15º43’N 90º<br />
µg-at/L<br />
Depth (m) T (ºC) S (º/ ºº<br />
) O 2 (mL/L) PO 4 -P NO 3 -N NO 2 -N SiO 3 -Si<br />
1 28.84 34.121 4.48 --- --- --- ---<br />
39 28.73 34.107 4.50 0.14 1.6 0.06 2.9<br />
58 28.28 34.275 4.90 0.14 u 0.04 3.5<br />
87 27.37 34.316 4.48 0.22 0.4 0.03 2.1<br />
111 26.86 34.491 4.09 --- --- --- ---<br />
130 25.38 34.732 2.61 0.24 11.3 0.17 7.6<br />
159 21.67 34.799 0.56 1.72 25.3 0.08 15.9<br />
207 16.73 34.877 0.14 2.10 33.0 0.13 28.6<br />
304 12.11 35.006 0.19 2.41 33.7 0.14 85.4?<br />
400 10.84 35.023 0.12 2.58 41.3 0.14 44.8<br />
497 10.08 35.028 0.17 --- --- --- ---<br />
593 9.32 35.016 0.31 2.60 38.8 0.08 56.9<br />
690 8.61 34.995 0.35 2.64 35.5 0.05 63.3<br />
786 8.06 34.984 0.54 2.69 36.4 0.07 66.6<br />
883 7.46 34.961 0.58 2.90 37.8 0.04 73.5<br />
979 6.87 34.948 0.83<br />
970 6.88 34.948 0.76<br />
1164 5.82 34.903 1.21<br />
1456 4.45 34.855 1.69<br />
1751 3.18 34.797 2.29<br />
2046 2.51 34.764 3.27<br />
<strong>MS20</strong> Lab <strong>Oxygen</strong> rev.3/27/2005 Page 12 of 16
Meteor; March 9; 56º37’N 44º54.5’W<br />
Depth (m) T (ºC) S (º/ ºº<br />
) σ t O 2 (mL/L) O 2 (%)<br />
0 2.82 34.87 27.80 7.24 96<br />
50 3.01 34.90 27.81 7.26 97<br />
100 3.09 34.92 27.82 7.24 97<br />
200 3.17 34.93 27.82 6.70 90<br />
800 3.26 34.96 27.83 6.98 94<br />
1000 3.20 34.95 27.83 6.96 93<br />
1500 3.17 34.93 27.82 6.99 94<br />
2000 3.23 34.93 27.82 --- ---<br />
Meteor; March 30; 59º38’N 40º42.5’W<br />
Depth (m) T (ºC) S (º/ ºº<br />
) σ t O 2 (mL/L) O 2 (%)<br />
0 4.07 34.96 27.76 6.92 95<br />
50 4.07 34.97 27.77 6.99 96<br />
100 4.06 34.96 27.77 6.81 94<br />
200 3.98 34.97 27.77 6.84 94<br />
800 3.76 34.95 27.77 6.60 90<br />
1000 3.33 34.89 27.77 6.64 89<br />
1500 3.28 34.94 27.82 6.39 86<br />
2000 2.84 34.96 27.88 6.37 87<br />
<strong>MS20</strong> Lab <strong>Oxygen</strong> rev.3/27/2005 Page 13 of 16
Name__________________ Lab Section_______________ Date________<br />
ANSWER SHEET <strong>Oxygen</strong> Lab<br />
Table Two<br />
Calibration water temp theoretical oxygen starting point ending point mLs of<br />
thiosulfate used<br />
1 st run<br />
2 nd run<br />
Average =<br />
Calculate your unknown concentrations using the average mls of thiosulfate from Table Two <strong>and</strong><br />
the known oxygen concentration from Table One in this equation:<br />
unknown O 2 concentration = known O 2 concentration x mL thiosulfate used for unknown / ml thiosulfate for known<br />
6. Determine the oxygen content of sample 2: 35 o / oo salinity water, room temperature.<br />
milliliters of thiosulfate solution calculate 0 2<br />
7. Determine the oxygen content of sample 3: polluted lake environment.<br />
milliliters of thiosulfate solution calculate 0 2<br />
8. Determine the oxygen content of sample 4: model lake – surface sample.<br />
milliliters of thiosulfate solution calculate 0 2<br />
9. Determine the oxygen content of sample 5: model lake - 75 cm down.<br />
milliliters of thiosulfate solution calculate 0 2<br />
10. Determine the oxygen content of sample 6: model lake - bottom.<br />
milliliters of thiosulfate solution calculate 0 2<br />
Answer the following questions:<br />
1. Assume you misread your buret end point <strong>and</strong> added too much thiosulfate solution for your<br />
st<strong>and</strong>ard. How would this affect all of your other results?<br />
<strong>MS20</strong> Lab <strong>Oxygen</strong> rev.3/27/2005 Page 14 of 16
2. What if someone mixed up the numbers of the water bottles in the laboratory "lake" so that the<br />
surface sample was the "polluted environment" sample? At what stage in the experiment could<br />
you first recognize the mix-up? Explain!<br />
3. In winter, some fresh water lakes have the same temperature from top to bottom (isothermal).<br />
Would the oxygen values also be the same from top to bottom? Explain!<br />
4. Consider the oxygen values listed in One. Also compare the measured oxygen values for the<br />
water at 0 o / oo <strong>and</strong> 35 o / oo salinity. In the open ocean, which factor, temperature or salinity, would<br />
have a more important effect on oxygen concentration? (hint: consider the<br />
range of temperatures <strong>and</strong> salinities that might occur going from the equator to the polar regions)<br />
5. Graph the distribution of oxygen in the model lake that you observed. Would this be typical of<br />
an actual lake environment? Why or why not?<br />
<strong>MS20</strong> Lab <strong>Oxygen</strong> rev.3/27/2005 Page 15 of 16
6. The percentage of saturation of a gas in seawater can be calculated from the physical<br />
properties of the water (temperature, salinity, <strong>and</strong> atmospheric pressure). Sometimes, however, in<br />
the case of oxygen we have super saturation occurring in the surface layers. Why? (hint:<br />
consider the coastal ocean <strong>and</strong> processes that add O 2 to the water)<br />
7. <strong>Oxygen</strong> is a non-conservative gas- that is, it is affected by biological processes. Assume for the<br />
moment, however, that no biological processes are taking place. Sketch in the oxygen curve<br />
(below right) to indicate the theoretical oxygen concentrations with depth. Consider that the<br />
oxygen gets into the seawater through the air/sea interface only, <strong>and</strong> its concentration is<br />
controlled by the physical factors of temperature <strong>and</strong> salinity (ignore pressure effects <strong>and</strong><br />
biological effects). (hint: consider what salinity <strong>and</strong> temperature are doing in each zone before<br />
plotting the oxygen curve!)<br />
<strong>MS20</strong> Lab <strong>Oxygen</strong> rev.3/27/2005 Page 16 of 16