Annual Performance Plan - Saps
Annual Performance Plan - Saps
Annual Performance Plan - Saps

Create successful ePaper yourself
Turn your PDF publications into a flip-book with our unique Google optimized e-Paper software.
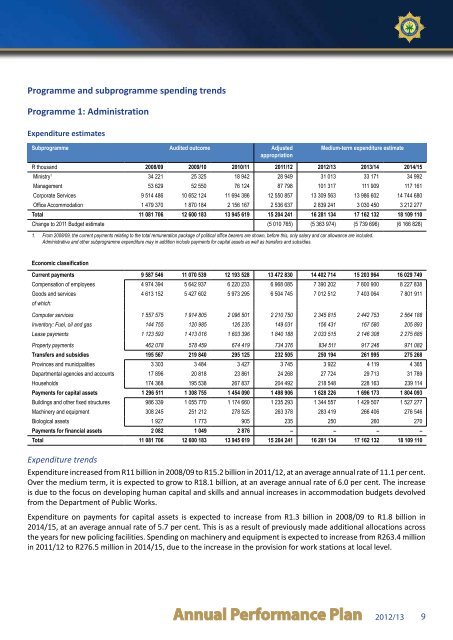
Programme and subprogramme spending trends<br />
Programme 1: Administration<br />
Expenditure estimates<br />
Subprogramme Audited outcome Adjusted<br />
appropriation<br />
Medium-term expenditure estimate<br />
R thousand 2008/09 2009/10 2010/11 2011/12 2012/13 2013/14 2014/15<br />
Ministry 1 34 221 25 325 18 942 28 949 31 013 33 171 34 992<br />
Management 53 629 52 550 76 124 87 798 101 317 111 909 117 161<br />
Corporate Services 9 514 486 10 652 124 11 694 386 12 550 857 13 309 563 13 986 602 14 744 680<br />
Office Accommodation 1 479 370 1 870 184 2 156 167 2 536 637 2 839 241 3 030 450 3 212 277<br />
Total 11 081 706 12 600 183 13 945 619 15 204 241 16 281 134 17 162 132 18 109 110<br />
Change to 2011 Budget estimate (5 010 765) (5 363 974) (5 739 696) (6 166 828)<br />
1. From 2008/09, the current payments relating to the total remuneration package of political office bearers are shown, before this, only salary and car allowance are included.<br />
Administrative and other subprogramme expenditure may in addition include payments for capital assets as well as transfers and subsidies.<br />
Economic classification<br />
Current payments 9 587 546 11 070 539 12 193 528 13 472 830 14 402 714 15 203 964 16 029 749<br />
Compensation of employees 4 974 394 5 642 937 6 220 233 6 968 085 7 390 202 7 800 900 8 227 838<br />
Goods and services 4 613 152 5 427 602 5 973 295 6 504 745 7 012 512 7 403 064 7 801 911<br />
of which:<br />
Computer services 1 557 575 1 914 805 2 096 501 2 210 750 2 345 815 2 442 753 2 564 188<br />
Inventory: Fuel, oil and gas 144 755 120 985 126 235 149 031 156 431 167 580 205 893<br />
Lease payments 1 123 593 1 413 016 1 603 396 1 840 188 2 033 515 2 146 308 2 275 685<br />
Property payments 462 078 578 459 674 419 734 376 834 511 917 246 971 082<br />
Transfers and subsidies 195 567 219 840 295 125 232 505 250 194 261 995 275 268<br />
Provinces and municipalities 3 303 3 484 3 427 3 745 3 922 4 119 4 365<br />
Departmental agencies and accounts 17 896 20 818 23 861 24 268 27 724 29 713 31 789<br />
Households 174 368 195 538 267 837 204 492 218 548 228 163 239 114<br />
Payments for capital assets 1 296 511 1 308 755 1 454 090 1 498 906 1 628 226 1 696 173 1 804 093<br />
Buildings and other fixed structures 986 339 1 055 770 1 174 660 1 235 293 1 344 557 1 429 507 1 527 277<br />
Machinery and equipment 308 245 251 212 278 525 263 378 283 419 266 406 276 546<br />
Biological assets 1 927 1 773 905 235 250 260 270<br />
Payments for financial assets 2 082 1 049 2 876 – – – –<br />
Total 11 081 706 12 600 183 13 945 619 15 204 241 16 281 134 17 162 132 18 109 110<br />
Expenditure trends<br />
Expenditure increased from R11 billion in 2008/09 to R15.2 billion in 2011/12, at an average annual rate of 11.1 per cent.<br />
Over the medium term, it is expected to grow to R18.1 billion, at an average annual rate of 6.0 per cent. The increase<br />
is due to the focus on developing human capital and skills and annual increases in accommodation budgets devolved<br />
from the Department of Public Works.<br />
Expenditure on payments for capital assets is expected to increase from R1.3 billion in 2008/09 to R1.8 billion in<br />
2014/15, at an average annual rate of 5.7 per cent. This is as a result of previously made additional allocations across<br />
the years for new policing facilities. Spending on machinery and equipment is expected to increase from R263.4 million<br />
in 2011/12 to R276.5 million in 2014/15, due to the increase in the provision for work stations at local level.<br />
<strong>Annual</strong> <strong>Performance</strong> <strong>Plan</strong> 2012/13 9