Annual Performance Plan - Saps
Annual Performance Plan - Saps
Annual Performance Plan - Saps

Create successful ePaper yourself
Turn your PDF publications into a flip-book with our unique Google optimized e-Paper software.
SOUTH AFRICAN POLICE SERVICE<br />
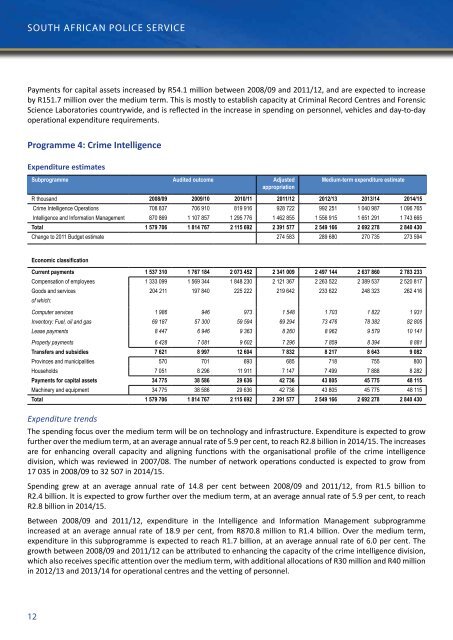
Payments for capital assets increased by R54.1 million between 2008/09 and 2011/12, and are expected to increase<br />
by R151.7 million over the medium term. This is mostly to establish capacity at Criminal Record Centres and Forensic<br />
Science Laboratories countrywide, and is reflected in the increase in spending on personnel, vehicles and day-to-day<br />
operational expenditure requirements.<br />
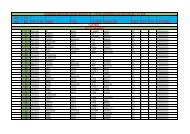
Programme 4: Crime Intelligence<br />
Expenditure estimates<br />
Subprogramme Audited outcome Adjusted<br />
appropriation<br />
Medium-term expenditure estimate<br />
R thousand 2008/09 2009/10 2010/11 2011/12 2012/13 2013/14 2014/15<br />
Crime Intelligence Operations 708 837 706 910 819 916 928 722 992 251 1 040 987 1 096 765<br />
Intelligence and Information Management 870 869 1 107 857 1 295 776 1 462 855 1 556 915 1 651 291 1 743 665<br />
Total 1 579 706 1 814 767 2 115 692 2 391 577 2 549 166 2 692 278 2 840 430<br />
Change to 2011 Budget estimate 274 583 289 680 270 735 273 594<br />
Economic classification<br />
Current payments 1 537 310 1 767 184 2 073 452 2 341 009 2 497 144 2 637 860 2 783 233<br />
Compensation of employees 1 333 099 1 569 344 1 848 230 2 121 367 2 263 522 2 389 537 2 520 817<br />
Goods and services 204 211 197 840 225 222 219 642 233 622 248 323 262 416<br />
of which:<br />
Computer services 1 986 946 973 1 548 1 703 1 822 1 931<br />
Inventory: Fuel, oil and gas 69 187 57 300 59 594 69 294 73 476 78 382 82 805<br />
Lease payments 8 447 6 946 9 363 8 260 8 962 9 579 10 141<br />
Property payments 6 428 7 081 9 602 7 296 7 859 8 394 8 881<br />
Transfers and subsidies 7 621 8 997 12 604 7 832 8 217 8 643 9 082<br />
Provinces and municipalities 570 701 693 685 718 755 800<br />
Households 7 051 8 296 11 911 7 147 7 499 7 888 8 282<br />
Payments for capital assets 34 775 38 586 29 636 42 736 43 805 45 775 48 115<br />
Machinery and equipment 34 775 38 586 29 636 42 736 43 805 45 775 48 115<br />
Total 1 579 706 1 814 767 2 115 692 2 391 577 2 549 166 2 692 278 2 840 430<br />
Expenditure trends<br />
The spending focus over the medium term will be on technology and infrastructure. Expenditure is expected to grow<br />
further over the medium term, at an average annual rate of 5.9 per cent, to reach R2.8 billion in 2014/15. The increases<br />
are for enhancing overall capacity and aligning functions with the organisational profile of the crime intelligence<br />
division, which was reviewed in 2007/08. The number of network operations conducted is expected to grow from<br />
17 035 in 2008/09 to 32 507 in 2014/15.<br />
Spending grew at an average annual rate of 14.8 per cent between 2008/09 and 2011/12, from R1.5 billion to<br />
R2.4 billion. It is expected to grow further over the medium term, at an average annual rate of 5.9 per cent, to reach<br />
R2.8 billion in 2014/15.<br />
Between 2008/09 and 2011/12, expenditure in the Intelligence and Information Management subprogramme<br />
increased at an average annual rate of 18.9 per cent, from R870.8 million to R1.4 billion. Over the medium term,<br />
expenditure in this subprogramme is expected to reach R1.7 billion, at an average annual rate of 6.0 per cent. The<br />
growth between 2008/09 and 2011/12 can be attributed to enhancing the capacity of the crime intelligence division,<br />
which also receives specific attention over the medium term, with additional allocations of R30 million and R40 million<br />
in 2012/13 and 2013/14 for operational centres and the vetting of personnel.<br />
12