twrama 1841_august_2.. - AMA WA
twrama 1841_august_2.. - AMA WA
twrama 1841_august_2.. - AMA WA

You also want an ePaper? Increase the reach of your titles
YUMPU automatically turns print PDFs into web optimized ePapers that Google loves.
PHOTOGRAPHY<br />
Notice there are no are no ‘bars’ running vertically at either the<br />
left or right hand side of the histogram in Fig. 4 – something you<br />
wish to avoid in the majority of your photos.<br />
‘Bars’ climbing vertically up the left hand side of the histogram<br />
(like in Fig. 5) tells you that you have underexposed the image<br />
and you did not capture details in the dark shadow areas. ‘Bars’<br />
climbing vertically up the right hand side of the histogram (like<br />
in Fig. 6) shows you have overexposed the image and did not<br />
captured details in the bright areas.<br />
you are wasting fully half of the available encoding ability of your<br />
camera. The simple lesson is to bias your exposures so that the<br />
histogram is snugged up to the right hand side, but not to the<br />
point where you have some of the ‘bars’ climbing vertically up. If<br />
the latter happens you have blown the highlights in your images<br />
and these can never be ‘recaptured’. Using the ‘flashing alert’ or<br />
‘blinking’ function on your camera will help avoid this happening.<br />
To move the histogram to the right, simply let in more light<br />
to the sensor, by opening the aperture further, or increasing<br />
the time the aperture is open or increasing the ISO level.<br />
Fig. 8 shows a ‘centred’ histogram and the same one pushed<br />
to the right but not allowing it to climb vertically up the right<br />
hand side.<br />
Fig. 5: Histogram of an underexposed<br />
image.<br />
Fig. 6: Histogram of an overexposed<br />
image.<br />
If your histogram has verticals ‘bars’ running up both the left<br />
and right sides, it means you has lost, or ‘clipped’ details in both the<br />
shadows and highlights. This happens when the range of light levels<br />
in the scene, from the darkest to the brightest, is more than the sensor<br />
in your camera can cope with. There will be too much contrast in<br />
what you are trying to photograph, to capture in one shot.<br />
Fig 8: Histogram showing the principle of ‘shooting to the right’.<br />
Use the histogram to help you shoot to the right<br />
Fig. 7 shows a histogram box without the ‘bars’ and somewhat<br />
arbitrarily divided into five equal zones or tones. Intuitively you<br />
would think your camera’s sensor would be capable of capturing<br />
and recording the same amount of digital data (or tones) from<br />
each zone in any scene.<br />
Fig. 7: Histogram divided into five zones.<br />
Alas, this is not the way it works. The way it really works is<br />
that the ‘Very Light’ zone captures fully half or 50 per cent of the<br />
digital data (tones) available in whatever you are photographing.<br />
The next ‘Light’ zone captures 50 per cent of what the ‘Very<br />
Light’ zone has already captured. The ‘Medium’ zone captures 50<br />
per cent of what the ‘Light’ zone has already captured, and so on<br />
as we move towards the last ‘Very Dark’ zone. This means the first<br />
three zones alone capture 87.5 per cent of the digital data (tones)<br />
you can possibly capture in any photograph. The 85 per cent is<br />
made up of 50 per cent (‘very light’ zone), plus 50 per cent of 50<br />
per cent or 25 per cent (‘light’ zone), plus 50 per cent of 25 per<br />
cent or 1<strong>2.</strong>5 per cent (‘medium’ zone).<br />
The message is clear. If you are not using the right-hand side of<br />
the histogram for capturing and recording much of your images,<br />
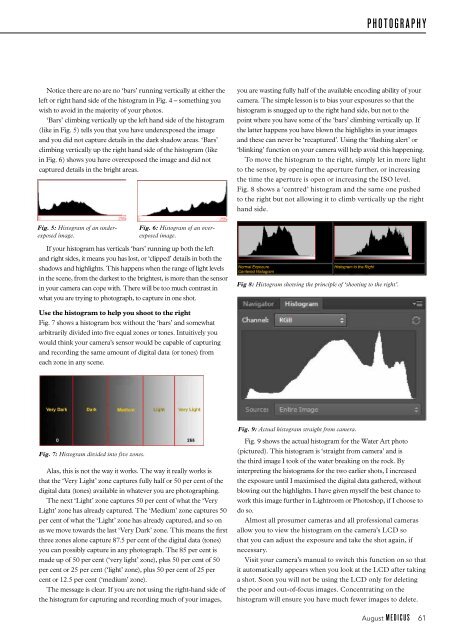
Fig. 9: Actual histogram straight from camera.<br />
Fig. 9 shows the actual histogram for the Water Art photo<br />
(pictured). This histogram is ‘straight from camera’ and is<br />
the third image I took of the water breaking on the rock. By<br />
interpreting the histograms for the two earlier shots, I increased<br />
the exposure until I maximised the digital data gathered, without<br />
blowing out the highlights. I have given myself the best chance to<br />
work this image further in Lightroom or Photoshop, if I choose to<br />
do so.<br />
Almost all prosumer cameras and all professional cameras<br />
allow you to view the histogram on the camera’s LCD so<br />
that you can adjust the exposure and take the shot again, if<br />
necessary.<br />
Visit your camera’s manual to switch this function on so that<br />
it automatically appears when you look at the LCD after taking<br />
a shot. Soon you will not be using the LCD only for deleting<br />
the poor and out-of-focus images. Concentrating on the<br />
histogram will ensure you have much fewer images to delete.<br />
August MEDICUS 61