Hydrography of the Russian River Estuary - Sonoma County Water ...
Hydrography of the Russian River Estuary - Sonoma County Water ...
Hydrography of the Russian River Estuary - Sonoma County Water ...

Create successful ePaper yourself
Turn your PDF publications into a flip-book with our unique Google optimized e-Paper software.
water) or it may reflect vertical mixing, which is expected to be strongest due to strong<br />
winds near <strong>the</strong> mouth. This phenomenon deserves more attention.<br />
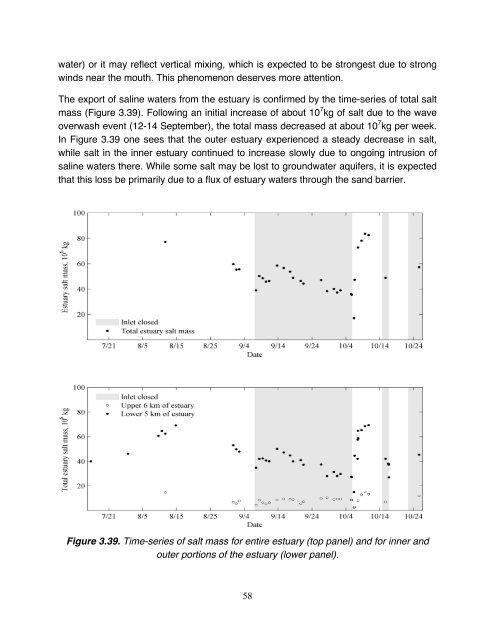
The export <strong>of</strong> saline waters from <strong>the</strong> estuary is confirmed by <strong>the</strong> time-series <strong>of</strong> total salt<br />
mass (Figure 3.39). Following an initial increase <strong>of</strong> about 10 7 kg <strong>of</strong> salt due to <strong>the</strong> wave<br />
overwash event (12-14 September), <strong>the</strong> total mass decreased at about 10 7 kg per week.<br />
In Figure 3.39 one sees that <strong>the</strong> outer estuary experienced a steady decrease in salt,<br />
while salt in <strong>the</strong> inner estuary continued to increase slowly due to ongoing intrusion <strong>of</strong><br />
saline waters <strong>the</strong>re. While some salt may be lost to groundwater aquifers, it is expected<br />
that this loss be primarily due to a flux <strong>of</strong> estuary waters through <strong>the</strong> sand barrier.<br />
Figure 3.39. Time-series <strong>of</strong> salt mass for entire estuary (top panel) and for inner and<br />
outer portions <strong>of</strong> <strong>the</strong> estuary (lower panel).<br />
58