Hydrography of the Russian River Estuary - Sonoma County Water ...
Hydrography of the Russian River Estuary - Sonoma County Water ...
Hydrography of the Russian River Estuary - Sonoma County Water ...

You also want an ePaper? Increase the reach of your titles
YUMPU automatically turns print PDFs into web optimized ePapers that Google loves.
Fur<strong>the</strong>r, it is expected that this flux is likely to be stronger near-surface owing to <strong>the</strong><br />
narrower berm at this height and thus shorter travel distances (see Equation 3 in section<br />
3.1.3). Alternatively, <strong>the</strong> outflux <strong>of</strong> estuary waters may be strongest at a preferred depth,<br />
as suggested by <strong>the</strong> results shown in Figure 3.6 (e.g., a high-conductivity route through<br />
<strong>the</strong> rip-rap underlying <strong>the</strong> jetty). Ei<strong>the</strong>r way, <strong>the</strong> dominant flux is likely to be above 0ft<br />
NGVD and comprised primarily <strong>of</strong> water with salinity less than 10psu (see Figure 3.20).<br />
Indeed if one simply compares <strong>the</strong> ratio <strong>of</strong> salt lost and water lost over common periods<br />
between wave-overwash events, one obtains an average salinity <strong>of</strong> 12.4kg/m 3 ~<br />
12.4psu. While this may include some high-salinity bottom water, it is clear that <strong>the</strong><br />
majority <strong>of</strong> water and salt is lost from above <strong>the</strong> pycnocline. Analyses for specific<br />
periods are listed in Table 3.1 – one can see that <strong>the</strong> salinity <strong>of</strong> water lost is decreasing,<br />
presumably due to <strong>the</strong> increased water level and increased potential for berm<br />
throughflow above <strong>the</strong> height <strong>of</strong> <strong>the</strong> pycnocline, which remains relatively constant<br />
(Figure 3.20).<br />
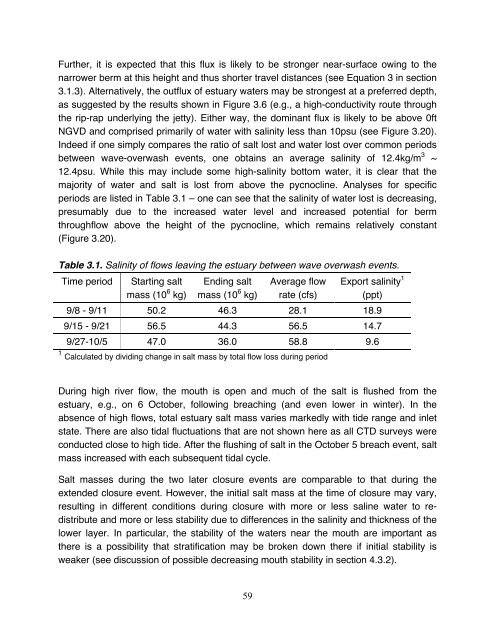
Table 3.1. Salinity <strong>of</strong> flows leaving <strong>the</strong> estuary between wave overwash events.<br />
Time period<br />
Starting salt<br />
mass (10 6 kg)<br />
Ending salt<br />
mass (10 6 kg)<br />
Average flow<br />
rate (cfs)<br />
Export salinity 1<br />
(ppt)<br />
9/8 - 9/11 50.2 46.3 28.1 18.9<br />
9/15 - 9/21 56.5 44.3 56.5 14.7<br />
9/27-10/5 47.0 36.0 58.8 9.6<br />
1 Calculated by dividing change in salt mass by total flow loss during period<br />
During high river flow, <strong>the</strong> mouth is open and much <strong>of</strong> <strong>the</strong> salt is flushed from <strong>the</strong><br />
estuary, e.g., on 6 October, following breaching (and even lower in winter). In <strong>the</strong><br />
absence <strong>of</strong> high flows, total estuary salt mass varies markedly with tide range and inlet<br />
state. There are also tidal fluctuations that are not shown here as all CTD surveys were<br />
conducted close to high tide. After <strong>the</strong> flushing <strong>of</strong> salt in <strong>the</strong> October 5 breach event, salt<br />
mass increased with each subsequent tidal cycle.<br />
Salt masses during <strong>the</strong> two later closure events are comparable to that during <strong>the</strong><br />
extended closure event. However, <strong>the</strong> initial salt mass at <strong>the</strong> time <strong>of</strong> closure may vary,<br />
resulting in different conditions during closure with more or less saline water to redistribute<br />
and more or less stability due to differences in <strong>the</strong> salinity and thickness <strong>of</strong> <strong>the</strong><br />
lower layer. In particular, <strong>the</strong> stability <strong>of</strong> <strong>the</strong> waters near <strong>the</strong> mouth are important as<br />
<strong>the</strong>re is a possibility that stratification may be broken down <strong>the</strong>re if initial stability is<br />
weaker (see discussion <strong>of</strong> possible decreasing mouth stability in section 4.3.2).<br />
59