Hydrography of the Russian River Estuary - Sonoma County Water ...
Hydrography of the Russian River Estuary - Sonoma County Water ...
Hydrography of the Russian River Estuary - Sonoma County Water ...

You also want an ePaper? Increase the reach of your titles
YUMPU automatically turns print PDFs into web optimized ePapers that Google loves.
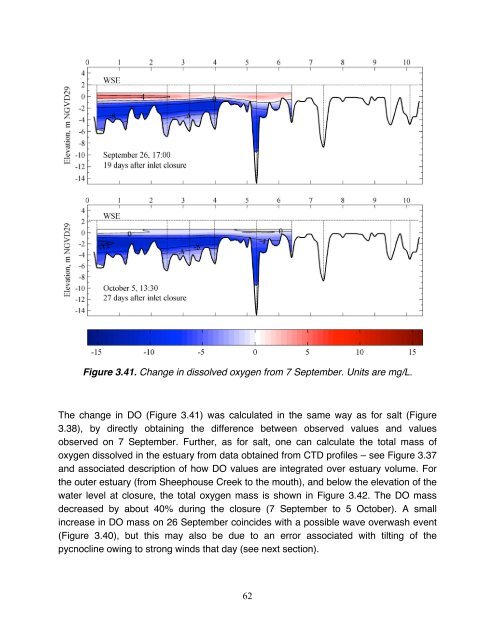
Figure 3.41. Change in dissolved oxygen from 7 September. Units are mg/L.<br />
The change in DO (Figure 3.41) was calculated in <strong>the</strong> same way as for salt (Figure<br />
3.38), by directly obtaining <strong>the</strong> difference between observed values and values<br />
observed on 7 September. Fur<strong>the</strong>r, as for salt, one can calculate <strong>the</strong> total mass <strong>of</strong><br />
oxygen dissolved in <strong>the</strong> estuary from data obtained from CTD pr<strong>of</strong>iles – see Figure 3.37<br />
and associated description <strong>of</strong> how DO values are integrated over estuary volume. For<br />
<strong>the</strong> outer estuary (from Sheephouse Creek to <strong>the</strong> mouth), and below <strong>the</strong> elevation <strong>of</strong> <strong>the</strong><br />
water level at closure, <strong>the</strong> total oxygen mass is shown in Figure 3.42. The DO mass<br />
decreased by about 40% during <strong>the</strong> closure (7 September to 5 October). A small<br />
increase in DO mass on 26 September coincides with a possible wave overwash event<br />
(Figure 3.40), but this may also be due to an error associated with tilting <strong>of</strong> <strong>the</strong><br />
pycnocline owing to strong winds that day (see next section).<br />
62