Lecture Notes on Compositional Data Analysis - Sedimentology ...
Lecture Notes on Compositional Data Analysis - Sedimentology ...
Lecture Notes on Compositional Data Analysis - Sedimentology ...

Create successful ePaper yourself
Turn your PDF publications into a flip-book with our unique Google optimized e-Paper software.
10 Chapter 2. Sample space<br />
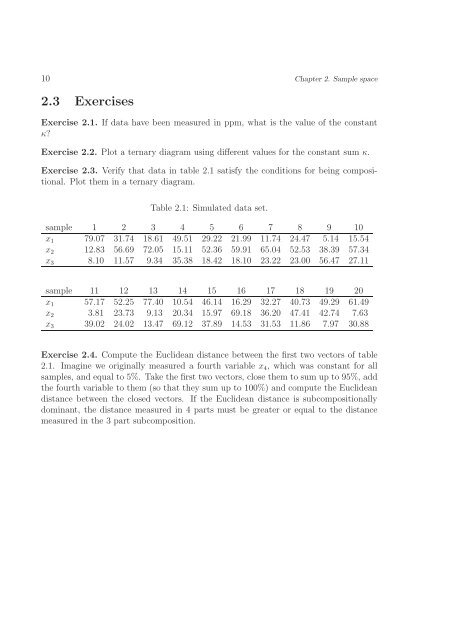
2.3 Exercises<br />
Exercise 2.1. If data have been measured in ppm, what is the value of the c<strong>on</strong>stant<br />
κ?<br />
Exercise 2.2. Plot a ternary diagram using different values for the c<strong>on</strong>stant sum κ.<br />
Exercise 2.3. Verify that data in table 2.1 satisfy the c<strong>on</strong>diti<strong>on</strong>s for being compositi<strong>on</strong>al.<br />
Plot them in a ternary diagram.<br />
Table 2.1: Simulated data set.<br />
sample 1 2 3 4 5 6 7 8 9 10<br />
x 1 79.07 31.74 18.61 49.51 29.22 21.99 11.74 24.47 5.14 15.54<br />
x 2 12.83 56.69 72.05 15.11 52.36 59.91 65.04 52.53 38.39 57.34<br />
x 3 8.10 11.57 9.34 35.38 18.42 18.10 23.22 23.00 56.47 27.11<br />
sample 11 12 13 14 15 16 17 18 19 20<br />
x 1 57.17 52.25 77.40 10.54 46.14 16.29 32.27 40.73 49.29 61.49<br />
x 2 3.81 23.73 9.13 20.34 15.97 69.18 36.20 47.41 42.74 7.63<br />
x 3 39.02 24.02 13.47 69.12 37.89 14.53 31.53 11.86 7.97 30.88<br />
Exercise 2.4. Compute the Euclidean distance between the first two vectors of table<br />
2.1. Imagine we originally measured a fourth variable x 4 , which was c<strong>on</strong>stant for all<br />
samples, and equal to 5%. Take the first two vectors, close them to sum up to 95%, add<br />
the fourth variable to them (so that they sum up to 100%) and compute the Euclidean<br />
distance between the closed vectors. If the Euclidean distance is subcompositi<strong>on</strong>ally<br />
dominant, the distance measured in 4 parts must be greater or equal to the distance<br />
measured in the 3 part subcompositi<strong>on</strong>.