Lecture Notes on Compositional Data Analysis - Sedimentology ...
Lecture Notes on Compositional Data Analysis - Sedimentology ...
Lecture Notes on Compositional Data Analysis - Sedimentology ...

Create successful ePaper yourself
Turn your PDF publications into a flip-book with our unique Google optimized e-Paper software.
44 Chapter 5. Exploratory data analysis<br />
−1.0 −0.5 0.0 0.5 1.0<br />
Variances<br />
0.00 0.05 0.10 0.15 0.20<br />
71 %<br />
90 %<br />
98 %<br />
100 %<br />
Comp.2<br />
−0.4 −0.2 0.0 0.2 0.4<br />
16<br />
2<br />
10<br />
5<br />
Na2O<br />
TiO2<br />
P2O5Al2O3<br />
CaO<br />
K2O<br />
17<br />
14<br />
15<br />
13<br />
1<br />
11<br />
8<br />
12<br />
7<br />
SiO2 MnO<br />
FeO<br />
Fe2O3<br />
9<br />
6<br />
3<br />
MgO<br />
4<br />
−1.0 −0.5 0.0 0.5 1.0<br />
−0.4 −0.2 0.0 0.2 0.4<br />
Comp.1<br />
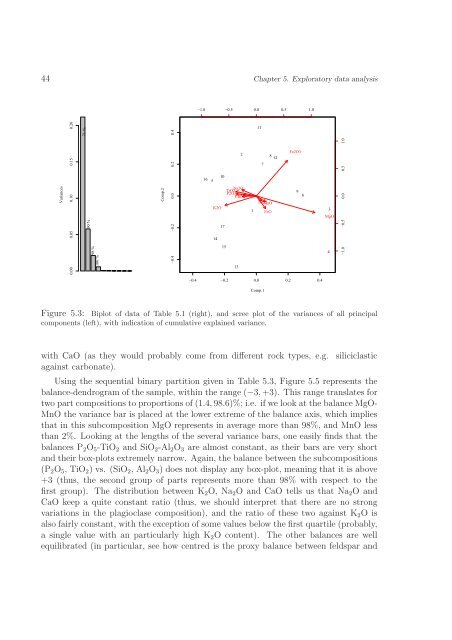
Figure 5.3: Biplot of data of Table 5.1 (right), and scree plot of the variances of all principal<br />
comp<strong>on</strong>ents (left), with indicati<strong>on</strong> of cumulative explained variance.<br />
with CaO (as they would probably come from different rock types, e.g. siliciclastic<br />
against carb<strong>on</strong>ate).<br />
Using the sequential binary partiti<strong>on</strong> given in Table 5.3, Figure 5.5 represents the<br />
balance-dendrogram of the sample, within the range (−3, +3). This range translates for<br />
two part compositi<strong>on</strong>s to proporti<strong>on</strong>s of (1.4, 98.6)%; i.e. if we look at the balance MgO-<br />
MnO the variance bar is placed at the lower extreme of the balance axis, which implies<br />
that in this subcompositi<strong>on</strong> MgO represents in average more than 98%, and MnO less<br />
than 2%. Looking at the lengths of the several variance bars, <strong>on</strong>e easily finds that the<br />
balances P 2 O 5 -TiO 2 and SiO 2 -Al 2 O 3 are almost c<strong>on</strong>stant, as their bars are very short<br />
and their box-plots extremely narrow. Again, the balance between the subcompositi<strong>on</strong>s<br />
(P 2 O 5 , TiO 2 ) vs. (SiO 2 , Al 2 O 3 ) does not display any box-plot, meaning that it is above<br />
+3 (thus, the sec<strong>on</strong>d group of parts represents more than 98% with respect to the<br />
first group). The distributi<strong>on</strong> between K 2 O, Na 2 O and CaO tells us that Na 2 O and<br />
CaO keep a quite c<strong>on</strong>stant ratio (thus, we should interpret that there are no str<strong>on</strong>g<br />
variati<strong>on</strong>s in the plagioclase compositi<strong>on</strong>), and the ratio of these two against K 2 O is<br />
also fairly c<strong>on</strong>stant, with the excepti<strong>on</strong> of some values below the first quartile (probably,<br />
a single value with an particularly high K 2 O c<strong>on</strong>tent). The other balances are well<br />
equilibrated (in particular, see how centred is the proxy balance between feldspar and