Wastewater Annual Report - City of Scotts Valley
Wastewater Annual Report - City of Scotts Valley
Wastewater Annual Report - City of Scotts Valley

You also want an ePaper? Increase the reach of your titles
YUMPU automatically turns print PDFs into web optimized ePapers that Google loves.
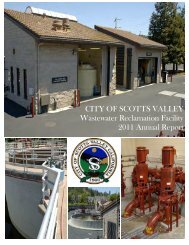
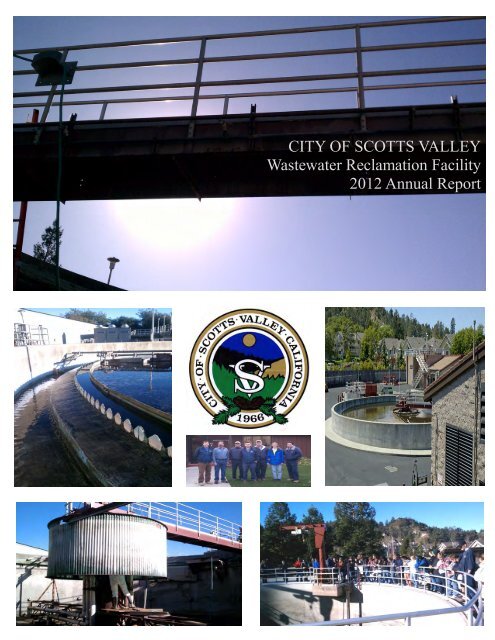
CITY OF SCOTTS VALLEY<br />
<strong>Wastewater</strong> Reclamation Facility<br />
2012 <strong>Annual</strong> <strong>Report</strong><br />
CITY OF SCOTTS VALLEY<br />
<strong>Wastewater</strong> Reclamation Facility<br />
2011 <strong>Annual</strong> <strong>Report</strong>
CITY OF SCOTTS VALLEY<br />
WASTEWATER TREATMENT FACILITY<br />
ANNUAL REPORT 2012<br />
Plant Summary and Compliance<br />
A record 61.49 million gallons <strong>of</strong> recycled water was used in 2012! That’s nearly seven<br />
million more gallons than in 2011. The <strong>Scotts</strong> <strong>Valley</strong> Water District continues to pursue<br />
additional recycled water users so we anticipate that we will continue to see increased<br />
recycled water usage.<br />
An equipment failure at the close <strong>of</strong> 2012 led to a series <strong>of</strong> four violations for the month<br />
<strong>of</strong> December. A main seal failure in clarifier #3 failed and the clarifier needed to be<br />
taken out <strong>of</strong> service for a short time until repairs could be made. We violated the<br />
effluent 7-day averages for BOD, cBOD, and total suspended solids. These are the first<br />
violations since 2008 when the plant exceeded its TCDD (Dioxin) limit.<br />
For the year 2012, effluent suspended solids averaged 11.0 mg/L (a 95.8% removal<br />
rate), effluent cBOD’s averaged 5 mg/L (a 97.9% removal rate), and effluent BOD’s<br />
averaged 5 mg/L (a 98.1% removal rate). Many thanks to a very knowledgeable and<br />
dedicated treatment plant staff. Without them, the continued high standards the <strong>City</strong><br />
has become accustomed to would not be possible.<br />
We are very proud to announce that Operator II, Tony Alvarez and Senior Laboratory<br />
Analyst, Kati King have been acknowledged by their peers in the Monterey Bay Section<br />
<strong>of</strong> the California Water Environment Association as Operator <strong>of</strong> the Year and Laboratory<br />
Person <strong>of</strong> the Year respectively. Congratulations to Tony and Katy for receiving these<br />
well deserved honors!<br />
Laboratory<br />
The <strong>City</strong> <strong>of</strong> <strong>Scotts</strong> <strong>Valley</strong> <strong>Wastewater</strong> Reclamation Facility Laboratory is busy<br />
accommodating EPA’s Final Methods Update Rule which includes new and revised<br />
wastewater methods and new QA/QC requirements for each analysis. The new<br />
methods update will be enforced during the middle <strong>of</strong> 2013.<br />
The new requirements will cause the analyst to spend more time on each analysis<br />
performed. It will be a challenge for the analyst to streamline the lab as much as<br />
possible in order to be able to complete all aspects <strong>of</strong> the job.<br />
1
Laboratories used during 2012 were:<br />
Inorganic Chemistry and Microbiology: Metals/Inorganic and Organic Chemistry:<br />
<strong>City</strong> <strong>of</strong> <strong>Scotts</strong> <strong>Valley</strong> WWTP<br />
BC Laboratories, Inc.<br />
700 Lundy Lane 4100 Atlas Ct.<br />
<strong>Scotts</strong> <strong>Valley</strong>, CA 95066 Bakersfield, CA 93308<br />
ELAP Certificate No. 1062 ELAP Certificate No. 1186<br />
<strong>Annual</strong> HVWS & Biosolid TCDD:<br />
Frontier Analytical Laboratory<br />
Aquatic Bioassay & Consulting Labs<br />
5172 Hillsdale Circle 29 N. Olive Street<br />
El Dorado Hills, CA 95762 Ventura, CA 93001<br />
ELAP Certificate No. CA02113 ELAP Certificate No. 1907<br />
Lift Stations<br />
The <strong>City</strong> <strong>of</strong> <strong>Scotts</strong> <strong>Valley</strong> owns and operates seven lift stations at various locations<br />
throughout the <strong>City</strong>. All stations are inspected three times each week. During these<br />
routine inspections, hour readings are taken to verify normal running times and flow<br />
throughput. Each pump is individually started and stopped to ensure proper operation,<br />
and wet-wells are visually inspected to confirm water levels with digital level reading on<br />
automatic pump controllers. Once each week, stations equipped with permanent<br />
emergency generators are tested on emergency power to ensure proper operation.<br />
Five stations are equipped with permanent emergency stand-by power. At this time, no<br />
other stations require permanent on-site emergency power, as limited flows allow ample<br />
time for <strong>City</strong> staff to respond to alarm conditions and provide portable generator power<br />
prior to overflows occurring.<br />
All <strong>of</strong> the <strong>City</strong>'s seven stations have back-up pumps and alarm systems that<br />
automatically call 24-hour emergency personnel in case <strong>of</strong> a power outage or high-level<br />
conditions.<br />
Collection System<br />
Following is a summary <strong>of</strong> the three collection system overflows reported by the <strong>City</strong> in<br />
2012:<br />
August 2 – Manhole on El Pueblo Road plugged spilling 1,100 gallons.<br />
Collection system cleaning in the area may have dislodged debris causing the<br />
plug. SSO Event ID 784555.<br />
October 15 – Plumber working on a private lateral released a large clump <strong>of</strong><br />
roots into <strong>City</strong>’s sewer main causing a blockage. An estimated 1,125 gallons<br />
spilled onto Mt. Hermon Road. SSO Event ID 787212.<br />
2
December 23 – Power failure during extreme rain event caused pump failure and<br />
subsequent overflow <strong>of</strong> 500-700 gallons from flow equalization tank at WWTP.<br />
SSO Event ID 789605.<br />
The <strong>City</strong>'s sanitary sewer collection system is made up <strong>of</strong> approximately 40 miles <strong>of</strong><br />
pipeline. <strong>City</strong> crews spend an average <strong>of</strong> two days each week performing preventative<br />
maintenance using a combination vacuum/hydro-jet truck to clean the lines.<br />
Source Control Program<br />
Industrial<br />
There are now two significant industrial users (SIU) in the <strong>City</strong> <strong>of</strong> <strong>Scotts</strong> <strong>Valley</strong>:<br />
ThermoFisher, a categorical metal finishing industry (40 CFR 433.15), and Bay Photo, a<br />
printer and photo processor discharging treated silver-bearing wastewater. During the<br />
month <strong>of</strong> July, results from a test and retest showed that nickel was over the limit by 1.3<br />
mg/L. In August, another retest was completed and the nickel levels remained only<br />
slightly above the limit. A retest in September had results within limits. The annual<br />
inspection was scheduled in August to discuss nickel exceedances. Steps were<br />
discussed for further treatment if the nickel exceedances continue.<br />
Groundwater Remediation: There were two groundwater pump and treat sites<br />
discharging to the sewer in the <strong>City</strong> <strong>of</strong> <strong>Scotts</strong> <strong>Valley</strong>, both under a permit. The<br />
responsible party for the first site is Shell Oil Products and Phillips 66 (formerly<br />
ConocoPhillips) managed by Conestoga-Rovers & Associates (CRA). Discharge began<br />
on March 7, 2008. The site has met all permit conditions to date. The second site is the<br />
Manana Woods Groundwater Well, owned by the San Lorenzo <strong>Valley</strong> Water District.<br />
The District started discharging filter backwash water on August 1, 2011. The backwash<br />
will be treated as necessary to remove pollutants to concentrations below the <strong>City</strong> <strong>of</strong><br />
<strong>Scotts</strong> <strong>Valley</strong> Sanitary Sewer discharge limits. The site has met all permit conditions to<br />
date. Two additional groundwater well sites owned by the <strong>Scotts</strong> <strong>Valley</strong> Water District<br />
will be permitted in early 2013.<br />
All categorical industries and the groundwater pump and treat site in the <strong>City</strong> were<br />
monitored and permitted through the pretreatment program in 2010.<br />
Grease Trap Installation and Maintenance<br />
The fats, oils, and greases (FOG) program is in place with most facilities operating in<br />
compliance with local ordinances. A handful <strong>of</strong> restaurants had minor violations that<br />
were corrected immediately following inspection. The most common area <strong>of</strong> correction<br />
in regards to stormwater and wastewater were improper maintenance <strong>of</strong> exterior waste<br />
containers and enclosure areas. These poor management practices can allow harmful<br />
3
solids and liquids to enter the storm drain; such as tallow and liquids from trash<br />
enclosures. The poor waste management practices included tallow bins covered with<br />
waste oil, oil spills around the drum/bins, trash around dumpsters and tallow bins left<br />
open at all times. The source control inspector worked with the tallow service and the<br />
business owners/managers to address this issue and properly clean or replace and<br />
service the tallow bins and, if necessary, hire a service to clean the enclosures to<br />
prevent the waste from entering the storm drain. Working with the tallow companies<br />
proved to be very beneficial and created an opportunity to express concerns and<br />
challenges on both ends and establish a positive relationship with the tallow service<br />
vendors. The business owners/managers were grateful to have support as well. Source<br />
Control continues to routinely inspect and monitor the conditions <strong>of</strong> the grease<br />
interceptors operating in <strong>Scotts</strong> <strong>Valley</strong>. A Best Environmental Management Practices<br />
pamphlet is being used as a training tool for local restaurant managers and owners.<br />
Maintenance and Repairs<br />
Made repairs to aeration panels<br />
Replaced bearings on backwash blowers for tertiary system<br />
Installed new motor for belt press lower drive<br />
Installed permanent chemical feed system for SulFree at Granite Creek Pump<br />
Station<br />
Rebuilt lower belt hydraulic rams on belt press<br />
Replace screening basket and spiral brush on screening washer<br />
Installed new secondary effluent pH probe<br />
Purchase and installed new SCADA computer<br />
Replaced check valves at Granite Creek Pump Station<br />
Installed new VFD for effluent pump P-10<br />
Installed rebuilt P-8 waste pump<br />
Installed new permanent emergency generator at Granite Creek Pump Station<br />
Clarifier #3 taken out <strong>of</strong> service for repairs (main seal failure)<br />
Rebuilt effluent pumps P-9 and P-10 (P-11 rebuild in progress at end <strong>of</strong> 2012)<br />
Other plant maintenance and repairs were performed as required<br />
O & M Manual<br />
The plant’s main operations and maintenance manual (O&M) was not changed during<br />
2012; however, the plant’s O&M manual library was updated to include new equipment<br />
that was placed into service over the past year. Updating the plant’s O&M manual<br />
takes place on an ongoing basis. We have one O&M manual that is used for<br />
operational guidelines and minor service to plant equipment. We also catalog individual<br />
O&M’s for every piece <strong>of</strong> equipment in place at the treatment plant, collection system,<br />
and lift stations.<br />
4
Training<br />
All staff was retrained in the biannual Red Cross Adult CPR and Standard First<br />
Aid Certification Program.<br />
All staff participates in the plant’s in-house safety/training meetings that are<br />
conducted every other Wednesday throughout the year.<br />
All Operations and Laboratory staff participated in several one-day training classes<br />
and seminars related to wastewater treatment, laboratory and maintenance.<br />
Public Education/Outreach<br />
The <strong>Scotts</strong> <strong>Valley</strong> Green Schools Program was developed in 2010 to provide<br />
environmental education to <strong>Scotts</strong> <strong>Valley</strong> students and to encourage the institution <strong>of</strong><br />
best environmental practices at the schools following the model <strong>of</strong> the Green Business<br />
Program. The Green Schools Program was funded by the <strong>City</strong> <strong>of</strong> <strong>Scotts</strong> <strong>Valley</strong>, and<br />
<strong>of</strong>fered free to the area schools. It was <strong>of</strong>fered to the ninth graders at <strong>Scotts</strong> <strong>Valley</strong><br />
High School, and to the fifth graders at Vine Hill Elementary School and Baymonte<br />
Christian School, two grade levels in which ecology concepts are taught. In 2010-2011,<br />
two series <strong>of</strong> presentations and three community service events were <strong>of</strong>fered at <strong>Scotts</strong><br />
<strong>Valley</strong> High School. Two series <strong>of</strong> presentations were also <strong>of</strong>fered at Vine Hill<br />
Elementary, along with a Save Our Shores presentation, and the formation <strong>of</strong> an<br />
Environmental Leadership Council. In 2012, due to a cutback in funds, only one set <strong>of</strong><br />
presentations were given at Vine Hill Elementary.<br />
The 2012 Vine Hill program consisted <strong>of</strong> a one-hour program on water issues to 80 fifth<br />
graders on October 26, 2012. The program addressed two areas: 1) the source <strong>of</strong><br />
water in <strong>Scotts</strong> <strong>Valley</strong> and the importance <strong>of</strong> water conservation measures, and 2)<br />
where water goes (sewer, septic systems, and the storm drain system), and the<br />
necessity <strong>of</strong> keeping storm drain water clean. LeAnne Ravinale from the <strong>Scotts</strong> <strong>Valley</strong><br />
Water District taught the first part <strong>of</strong> the program, using a model <strong>of</strong> an aquifer, and<br />
playing charades to act out water conservation strategies. The second part <strong>of</strong> the<br />
program was taught by Sheila Peck from the Green Schools Program. For this piece,<br />
students designed their own storm drain placards to explain why storm drains should be<br />
kept clean for plants and animals downstream. A second program at Vine Hill, as well<br />
as a two-day program at <strong>Scotts</strong> <strong>Valley</strong> High School, is planned for spring, 2013.<br />
The Monterey Bay Area Green Business Program continues to thrive. Goals <strong>of</strong> the<br />
Green Business Program include promoting pollution prevention, waste minimization,<br />
and implementing best management practices that go above and beyond the regulatory<br />
standards. Since its launch in July, 2004, the program has developed nineteen different<br />
business certification sectors, including: restaurants, plumbers, <strong>of</strong>fice/retail facilities,<br />
hotels/hospitality services, custodial companies, beauty salons, laundromats, wineries,<br />
painters, and landscapers, property management/multi-family dwellings, schools,<br />
medical facilities, garment cleaners, vehicle service facilities, auto body shops, printers,<br />
5
contractors/remodelers, and pharmacies. A significant portion <strong>of</strong> the program for<br />
restaurants, hotels, and plumbers is dedicated to minimizing discharges <strong>of</strong> fats, oils, and<br />
greases (FOG) into the sanitary sewer. The program is supported by a database<br />
launched in 2010, which allow it to collect metrics on water and energy savings, and<br />
pollution and waste reduction, and so assess the program’s impacts. Nineteen<br />
businesses have been certified to date in <strong>Scotts</strong> <strong>Valley</strong>. These businesses have been<br />
advertised in a local paper and will be advertised again in the spring.<br />
Having been certified for more than three years, several <strong>Scotts</strong> <strong>Valley</strong> green businesses<br />
underwent “recertification” in 2012. One such organization that demonstrated continued<br />
green achievement was the Central California Alliance for Health. With approximately<br />
200 employees, this group has made a significant and impressive conservation impact.<br />
Since it became certified in 2009, it has reduced CO2 emissions by 886,437 lbs, saved<br />
655,053 kWh <strong>of</strong> energy, 664,891 gallons <strong>of</strong> water, and 7,138 gallons <strong>of</strong> gas, and<br />
diverted 903,458 lbs <strong>of</strong> solid waste from the landfill.<br />
<strong>Scotts</strong> <strong>Valley</strong> <strong>City</strong> Staff, in collaboration with the County <strong>of</strong> Santa Cruz and other <strong>City</strong><br />
agencies, were successful in obtaining a grant in 2008 from the California Integrated<br />
Waste Management Board (CIWMB) in order to implement a pharmaceutical and<br />
sharps disposal program. Since that time, the Sharp Solutions for Home Medicines<br />
Program has provided a convenient and permanent system to dispose <strong>of</strong> homegenerated<br />
used sharps and unwanted pharmaceuticals in the County <strong>of</strong> Santa Cruz.<br />
The County has established 33 convenient and well-publicized drop-<strong>of</strong>f locations,<br />
primarily at pharmacies, throughout the region.<br />
Since 2010, the Palo Alto Medical Foundation (PAMF) has accepted medicines from its<br />
patients at its clinic in <strong>Scotts</strong> <strong>Valley</strong>. PAMF now <strong>of</strong>fers this service at all 5 <strong>of</strong> its major<br />
clinics in Santa Cruz County. Since PAMF’s program is limited to its patients and it<br />
covers all costs <strong>of</strong> the program, collection data from its sites is not available.<br />
From July 2008 through December 2012, over 73,000 pounds <strong>of</strong> sharps and<br />
pharmaceuticals have been collected and diverted from county landfills and water<br />
systems, thus reducing water pollution and public health risks. The three take-back<br />
sites in <strong>Scotts</strong> <strong>Valley</strong> alone collected 1,114 pounds <strong>of</strong> sharps and 1,937 pounds <strong>of</strong><br />
medicines during 2012. Compared to countywide data, these figures amount to 10%<br />
and 18%, respectively, <strong>of</strong> the two medical wastes collected in a city that comprises only<br />
4.4% <strong>of</strong> county population.<br />
The <strong>Scotts</strong> <strong>Valley</strong> Police Department, in cooperation with the County Sheriff’s Office,<br />
participated in the Federal Department <strong>of</strong> Justice’s National Drug Take-Back Days on<br />
April 28 and September 29, 2012. All drugs, including controlled substances, are<br />
allowed at these events. Residents turned in 120 pounds <strong>of</strong> drugs at the April collection<br />
day and 10 pounds in September. The Police Department plans to continue to<br />
participate in these events, and they are also considering a proposal from Sharp<br />
Solutions to become a permanent drug take-back site.<br />
6
Electronic Waste: On Saturday, September 15, 2012, the <strong>City</strong> <strong>of</strong> <strong>Scotts</strong> <strong>Valley</strong><br />
conducted its 10 th annual e-waste collection event. The <strong>City</strong> collected nearly 20,000<br />
pounds <strong>of</strong> electronics, mostly in the form <strong>of</strong> computers, monitors and television sets,<br />
from over 300 participants. These items are now banned from landfill disposal because<br />
<strong>of</strong> their hazardous material content <strong>of</strong> lead, mercury, and other heavy metals.<br />
Appliance Collection: The <strong>City</strong> <strong>of</strong> <strong>Scotts</strong> <strong>Valley</strong> held its 9 th annual Appliance<br />
Collection Event on Saturday, October 13. In the previous eight years the event<br />
included tire collection as well, but the <strong>City</strong> lost its grant to pay for tire disposal/recycling<br />
and is no longer able to <strong>of</strong>fer that service. 45 participants dropped <strong>of</strong>f a total <strong>of</strong> 5 water<br />
heaters, 3 washers, 4 dryers, 4 oven/stoves, 10 refrigerators and 20 misc. small<br />
appliances. Scrap metal from appliances was shredded, melted and made into new<br />
metal products.<br />
To address the new Mandatory Commercial Recycling legislation, Assembly Bill 341<br />
that went into effect July 1, 2012, the source control inspector conducted recycling<br />
outreach at all restaurants, auto body shops and auto repair shops. The inspector used<br />
the inspections as an opportunity to outreach and educate business owners and<br />
managers about the new legislation and explain their responsibility. Each business was<br />
given a Bilingual Recycling Poster to put up at their business indicating the various<br />
recyclable and non recyclable items.<br />
On an annual basis, the treatment plant staff provides a number <strong>of</strong> ongoing public<br />
outreach/education services. Some <strong>of</strong> those services include:<br />
Oil Recycling: As a member <strong>of</strong> the County's regional oil recycling program, the<br />
<strong>City</strong> distributes oil recycling containers to local automotive supply stores where<br />
they are distributed to residents at no cost. The 2.5 gallon used oil containers<br />
have labels containing information on proper disposal practices and can be used<br />
throughout the county in any curbside collection program as part <strong>of</strong> the integrated<br />
regional program.<br />
As always, plant tours are encouraged and given upon request to any person or<br />
group wishing to learn about the treatment process. Several individual and group<br />
tours were given in 2012.<br />
7
NPDES PERMIT EFFLUENT VIOLATIONS 2003-2012<br />
2003 2004 2005 2006 2007 2008 2009 2010 2011 2012<br />
January 0 0 0 0 0 0 0 0 0 0<br />
February 0 0 0 0 0 0 0 0 0 0<br />
March 0 0 0 0 0 0 0 0 0 0<br />
April 0 0 0 0 0 0 0 0 0 0<br />
May 0 0 0 0 0 0 0 0 0 0<br />
June 0 0 0 0 0 0 0 0 0 0<br />
July 0 0 0 0 0 0 0 0 0 0<br />
August 0 0 0 0 0 1* 0 0 0 0<br />
September 0 0 0 0 0 0 0 0 0 0<br />
October 0 0 0 0 0 0 0 0 0 0<br />
November 0 0 0 0 0 0 0 0 0 0<br />
December 0 0 0 0 0 0 0 0 0 4<br />
Total 0 0 0 0 0 1 0 0 0 4<br />
*TCDD<br />
Eff. Weekly<br />
Avg.BOD<br />
CBOD,TSS<br />
sett.solid<br />
8
TABLE 1<br />
2012 PLANT FLOW AND<br />
RAINFALL<br />
Total Effluent Effluent Recycled<br />
Plant Flow Daily Flow Inst. Max. Total Flow Rainfall<br />
Million<br />
Gallons<br />
Eff.+Rec.MGD MGD MGD<br />
Inches<br />
Mo. Total Mo. Total (peak) Mo. Total (Total)<br />
January 26.073 23.814 3.52 2.259 7.57<br />
February 22.911 20.369 2.33 2.542 2.37<br />
March 31.283 30.193 3.54 1.090 12.87<br />
April 26.722 25.160 2.53 1.562 3.58<br />
May 24.659 16.511 2.13 8.148 0.03<br />
June 23.288 13.488 3.10 9.800 0.17<br />
July 23.544 13.469 3.54 10.075 0.02<br />
August 23.375 12.721 1.74 10.654 0.00<br />
September 22.129 14.096 2.10 8.033 0.00<br />
October 23.099 17.917 2.57 5.182 1.59<br />
November 25.709 23.932 3.40 1.777 10.80<br />
December 32.884 32.518 3.58 0.366 13.67<br />
Total 305.68 244.19 61.49 52.67<br />
Average 25.47 20.35 2.84 5.12 4.39<br />
Maximum 32.88 32.52 3.58 10.65 13.67<br />
Minimum 22.13 12.72 1.74 0.37 0.00<br />
ADDWF, MGD 0.765<br />
Eff + Recycle<br />
9
TABLE 2<br />
2012 Influent & Effluent Suspended Solids<br />
Influent Effluent Effluent Percent<br />
mg/L mg/L lb/day Removal<br />
January 262 7 44 97.4%<br />
February 266 4 27 98.4%<br />
March 233 6 63 97.4%<br />
April 254 7 54 97.1%<br />
May 271 10 29 96.3%<br />
June 276 14 60 94.8%<br />
July 262 11 36 95.7%<br />
August 275 9 33 96.9%<br />
September 273 7 23 97.3%<br />
October 283 9 40 96.7%<br />
November 269 14 105 94.4%<br />
December 222 30 199 86.6%<br />
Average 262 11 59 95.8%<br />
Maximum 283 30 199 98.4%<br />
Minimum 222 4 23 86.6%<br />
10
TABLE 3<br />
2012 Influent & Effluent BOD & cBOD<br />
Influent Effluent Effluent BOD Influent Effluent Effluent cBOD<br />
BOD BOD BOD Percent cBOD cBOD cBOD Percent<br />
mg/L mg/L lb/day Removal mg/L mg/L lb/day Removal<br />
January 288 4 25 98.7% 239 3 21 98.7%<br />
February 308 3 19 99.1% 220 2 17 98.8%<br />
March 221 3 22 98.5% 173 3 18 98.4%<br />
April 260 5 36 97.9% 218 5 34 97.7%<br />
May 279 5 32 98.3% 226 4 25 98.4%<br />
June 293 4 30 98.5% 240 4 27 98.3%<br />
July 310 4 28 98.6% 248 3 22 98.6%<br />
August 331 4 28 98.8% 276 3 23 98.8%<br />
September 295 3 20 99.0% 253 2 17 99.0%<br />
October 300 4 27 98.6% 242 3 23 98.6%<br />
November 317 5 35 98.3% 254 4 28 98.4%<br />
December 241 18 123 92.9% 188 17 116 91.3%<br />
Average 287 5 36 98.1% 231 5 31 97.9%<br />
Maximum 331 18 123 99.1% 276 17 116 99.0%<br />
Minimum 221 3 19 92.9% 173 2 17 91.3%<br />
11
TABLE 4<br />
2012 Tertiary Effluent Nitrogen<br />
Tertiary Tertiary Tertiary Tertiary Influent Tertiary<br />
Ammonia<br />
Organic<br />
N Nitrate Nitrite Total N Nitrogen<br />
mg/L mg/L mg/L mg/L mg/L Removal<br />
as N as N as N as N as N Percent<br />
January 0.06 1.0 5.8 < 0.1 76 88.3<br />
February 0.04 0.7 3.1 < 0.1 72 90.0<br />
March 0.05 0.7 1.4 < 0.1 62 86.4<br />
April 1.16 0.5 < 1.0 < 0.1 64 84.8<br />
May 0.08 1.0 2.8 < 0.1 77 87.2<br />
June 0.09 1.0 4.5 < 0.1 76 86.2<br />
July 0.07 0.9 5.5 < 0.1 75 84.0<br />
August 0.08 1.0 4.6 < 0.1 78 90.8<br />
September 0.07 0.8 3.4 < 0.1 73 90.4<br />
October 0.07 0.9 2.5 < 0.1 79 88.4<br />
November 0.07 0.9 3.1 < 0.1 61 91.8<br />
December 0.90 0.8 1.1 < 0.1 58 91.5<br />
Average 0.23 0.8 3.2 < 0.1 70.7 88.3<br />
Maximum 1.16 1.0 5.8 < 0.1 78.6 91.8<br />
Minimum 0.04 0.5 1.0 < 0.1 58.0 84.0<br />
12
TABLE 5<br />
2012 Influent & Effluent pH and<br />
Effluent Turbidity, Settleable Solids, and Oil & Grease<br />
Influent Effluent Effluent Effluent Effluent Effluent<br />
Oil &<br />
Oil &<br />
pH pH Turbidity Settleable Grease<br />
Grease<br />
Std Units Std Units NTU Solids mg/L lb/day<br />
ml/L<br />
January 8.2 7.2 2.7 < 0.1 < 5 < 34<br />
February 8.2 7.3 2.8 < 0.1 < 5 < 34<br />
March 8.1 7.2 3.3 < 0.1 < 5 < 34<br />
April 8.1 7.2 7.8 < 0.1 < 5 < 34<br />
May 8.1 7.2 6.7 < 0.1 < 5 < 34<br />
June 8.1 7.2 5.0 < 0.1 < 5 < 34<br />
July 8.1 7.2 4.0 < 0.1 < 5 < 34<br />
August 8.1 7.2 3.1 < 0.1 < 5 < 34<br />
September 8.2 7.2 2.6 < 0.1 < 5 < 34<br />
October 8.2 7.3 3.0 < 0.1 < 5 < 34<br />
November 8.2 7.2 8.5 < 0.1 < 5 < 34<br />
December 8.0 7.1 8.0 < 0.1 < 5 < 34<br />
Average 8.1 7.2 4.8 < 0.1 < 5.0 < 34<br />
Maximum 8.2 7.3 8.5 < 0.1 < 5.0 < 34<br />
Minimum 8.0 7.1 2.6 < 0.1 < 4.6 < 34<br />
13
TABLE 6<br />
2012 Effluent Chlorine Residual and<br />
Bacteriological Quality<br />
Chlorine Total Fecal<br />
Enterococcu<br />
Residual Coliform Coliform<br />
s<br />
mg/L MPN/100mL MPN/100mL MPN/100mL<br />
@Santa Cruz<br />
January < 0.01 970 < 200 39<br />
February < 0.01 690 < 200 10<br />
March < 0.01 2000 < 200 18<br />
April < 0.01 1110 < 280 61<br />
May < 0.01 2083 217 42<br />
June < 0.01 3780 1210 32<br />
July < 0.01 2440 520 989<br />
August < 0.01 15430 890 284<br />
September < 0.01 2290 240 255<br />
October < 0.01 10620 < 2280 287<br />
November < 0.01 3110 < 310 89<br />
December < 0.01 6670 < 690 96<br />
Geometric < 0.01 2,790 < 422 < 83<br />
Maximum < 0.01 15,430 1,160 989<br />
Minimum < 0.01 690 < 200 10<br />
14
TABLE 7<br />
2012 Sludge<br />
Wasting<br />
WAS WAS WAS Hours Sludge Sludge<br />
Flow Percent<br />
Metric<br />
Tons Pressed Cake Hauled<br />
MGD Solids per month per/mnth<br />
%<br />
Solids Tons/mnth<br />
(dry wt)<br />
(dry wt)<br />
January 0.6987 0.92 22.3 123 15.3 29.0<br />
February 0.7558 0.92 25.4 125 15.0 27.1<br />
March 0.6484 0.97 25.6 119 15.2 31.0<br />
April 0.6308 1.03 29.2 127 15.5 27.5<br />
May 0.6694 0.94 26.0 135 15.4 26.0<br />
June 0.5297 0.98 28.6 105 15.7 26.9<br />
July 0.7142 0.99 30.8 143 15.1 24.3<br />
August 0.9750 0.90 25.3 128 14.3 26.2<br />
September 0.6266 0.89 26.3 123 14.8 21.8<br />
October 0.7083 0.80 20.1 139 15.0 24.8<br />
November 0.6425 0.80 20.1 128 14.4 26.2<br />
December 0.7272 0.74 15.9 140 14.7 29.4<br />
Total 8.327 295.5 1,534 320.2<br />
Average 0.694 0.91 24.6 128 15.0 26.7<br />
Maximum 0.975 1.03 30.8 143 15.7 31.0<br />
Minimum 0.530 0.74 15.9 105 14.3 21.8<br />
15
TABLE 8<br />
2012 Plant Operating Parameters<br />
Aerator Clarifier Total RAS MLSS<br />
Clar.<br />
SS MCRT F/M SVI<br />
lbs lbs lbs mg/L mg/L mg/L 7-day 7-day Ratio<br />
January 13727 9385 23,112 9467 5457 2217.8 10.0 0.19 168<br />
February 13813 8798 22,610 9015 5491 2079.0 8.2 0.19 167<br />
March 13693 9901 23,594 9387 5444 2339.8 8.9 0.22 167<br />
April 14805 12542 27,347 10011 5886 2963.7 10.1 0.19 154<br />
May 13972 9589 23,561 9263 5555 2265.9 8.9 0.19 160<br />
June 15083 11882 26,965 9501 5997 2807.9 11.1 0.17 157<br />
July 13682 9905 23,587 8725 5439 2340.6 8.1 0.18 170<br />
August 13180 9021 22,201 8614 5240 2131.7 8.0 0.19 172<br />
September 12559 10505 23,064 8053 4993 2482.4 8.2 0.20 190<br />
October 12573 9605 22,178 8106 4999 2269.8 9.0 0.20 194<br />
November 11957 11043 23,001 7754 4754 2609.7 9.0 0.21 205<br />
December 10249 14003 24,252 6990 4075 3309.0 9.4 0.35 233<br />
Average 13,274 10,515 23,789 8,741 5,277 2,485 9.1 0.21 178<br />
Maximum 15,083 14,003 27,347 10,011 5,997 3,309 11.1 0.35 233<br />
Minimum 10,249 8,798 22,178 6,990 4,075 2,079 8.0 0.17 154<br />
16
FIGURE 1<br />
FIGURE 2<br />
17
FIGURE 3<br />
FIGURE 4<br />
18
FIGURE 5<br />
FIGURE 6<br />
19
FIGURE 7<br />
FIGURE 8<br />
20
FIGURE 9<br />
FIGURE 10<br />
21
FIGURE 11<br />
FIGURE 12<br />
22
FIGURE 13<br />
FIGURE 14<br />
23
FIGURE 15<br />
FIGURE 16<br />
24
FIGURE 17<br />
FIGURE 18<br />
25
FIGURE 19<br />
FIGURE 20<br />
26