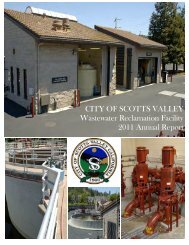
Wastewater Annual Report - City of Scotts Valley
Wastewater Annual Report - City of Scotts Valley
Wastewater Annual Report - City of Scotts Valley

Create successful ePaper yourself
Turn your PDF publications into a flip-book with our unique Google optimized e-Paper software.
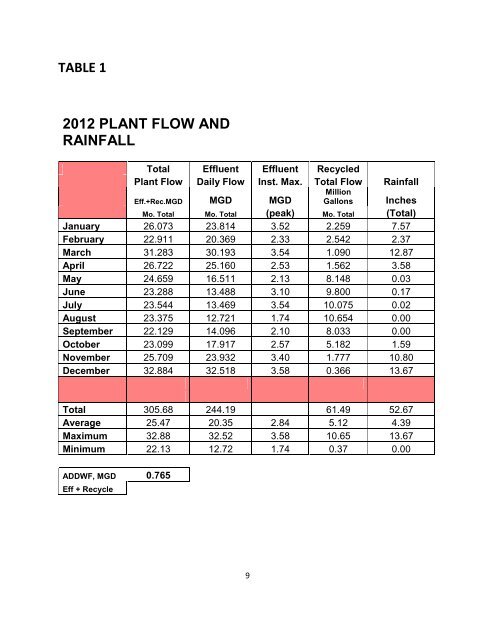
TABLE 1<br />
2012 PLANT FLOW AND<br />
RAINFALL<br />
Total Effluent Effluent Recycled<br />
Plant Flow Daily Flow Inst. Max. Total Flow Rainfall<br />
Million<br />
Gallons<br />
Eff.+Rec.MGD MGD MGD<br />
Inches<br />
Mo. Total Mo. Total (peak) Mo. Total (Total)<br />
January 26.073 23.814 3.52 2.259 7.57<br />
February 22.911 20.369 2.33 2.542 2.37<br />
March 31.283 30.193 3.54 1.090 12.87<br />
April 26.722 25.160 2.53 1.562 3.58<br />
May 24.659 16.511 2.13 8.148 0.03<br />
June 23.288 13.488 3.10 9.800 0.17<br />
July 23.544 13.469 3.54 10.075 0.02<br />
August 23.375 12.721 1.74 10.654 0.00<br />
September 22.129 14.096 2.10 8.033 0.00<br />
October 23.099 17.917 2.57 5.182 1.59<br />
November 25.709 23.932 3.40 1.777 10.80<br />
December 32.884 32.518 3.58 0.366 13.67<br />
Total 305.68 244.19 61.49 52.67<br />
Average 25.47 20.35 2.84 5.12 4.39<br />
Maximum 32.88 32.52 3.58 10.65 13.67<br />
Minimum 22.13 12.72 1.74 0.37 0.00<br />
ADDWF, MGD 0.765<br />
Eff + Recycle<br />
9