Wastewater Annual Report - City of Scotts Valley
Wastewater Annual Report - City of Scotts Valley
Wastewater Annual Report - City of Scotts Valley

You also want an ePaper? Increase the reach of your titles
YUMPU automatically turns print PDFs into web optimized ePapers that Google loves.
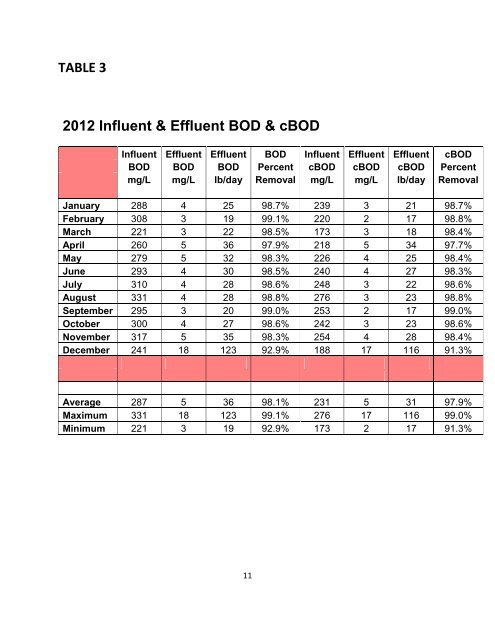
TABLE 3<br />
2012 Influent & Effluent BOD & cBOD<br />
Influent Effluent Effluent BOD Influent Effluent Effluent cBOD<br />
BOD BOD BOD Percent cBOD cBOD cBOD Percent<br />
mg/L mg/L lb/day Removal mg/L mg/L lb/day Removal<br />
January 288 4 25 98.7% 239 3 21 98.7%<br />
February 308 3 19 99.1% 220 2 17 98.8%<br />
March 221 3 22 98.5% 173 3 18 98.4%<br />
April 260 5 36 97.9% 218 5 34 97.7%<br />
May 279 5 32 98.3% 226 4 25 98.4%<br />
June 293 4 30 98.5% 240 4 27 98.3%<br />
July 310 4 28 98.6% 248 3 22 98.6%<br />
August 331 4 28 98.8% 276 3 23 98.8%<br />
September 295 3 20 99.0% 253 2 17 99.0%<br />
October 300 4 27 98.6% 242 3 23 98.6%<br />
November 317 5 35 98.3% 254 4 28 98.4%<br />
December 241 18 123 92.9% 188 17 116 91.3%<br />
Average 287 5 36 98.1% 231 5 31 97.9%<br />
Maximum 331 18 123 99.1% 276 17 116 99.0%<br />
Minimum 221 3 19 92.9% 173 2 17 91.3%<br />
11