Wastewater Annual Report - City of Scotts Valley
Wastewater Annual Report - City of Scotts Valley
Wastewater Annual Report - City of Scotts Valley

You also want an ePaper? Increase the reach of your titles
YUMPU automatically turns print PDFs into web optimized ePapers that Google loves.
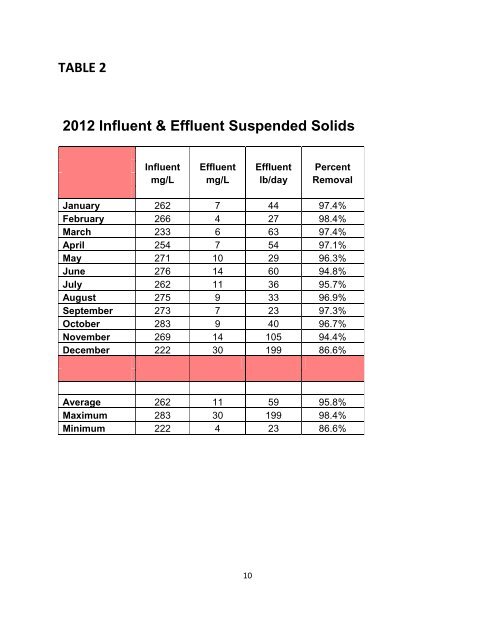
TABLE 2<br />
2012 Influent & Effluent Suspended Solids<br />
Influent Effluent Effluent Percent<br />
mg/L mg/L lb/day Removal<br />
January 262 7 44 97.4%<br />
February 266 4 27 98.4%<br />
March 233 6 63 97.4%<br />
April 254 7 54 97.1%<br />
May 271 10 29 96.3%<br />
June 276 14 60 94.8%<br />
July 262 11 36 95.7%<br />
August 275 9 33 96.9%<br />
September 273 7 23 97.3%<br />
October 283 9 40 96.7%<br />
November 269 14 105 94.4%<br />
December 222 30 199 86.6%<br />
Average 262 11 59 95.8%<br />
Maximum 283 30 199 98.4%<br />
Minimum 222 4 23 86.6%<br />
10