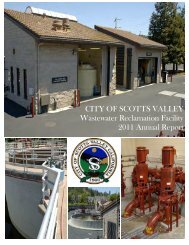
Wastewater Annual Report - City of Scotts Valley
Wastewater Annual Report - City of Scotts Valley
Wastewater Annual Report - City of Scotts Valley

You also want an ePaper? Increase the reach of your titles
YUMPU automatically turns print PDFs into web optimized ePapers that Google loves.
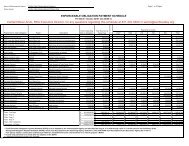
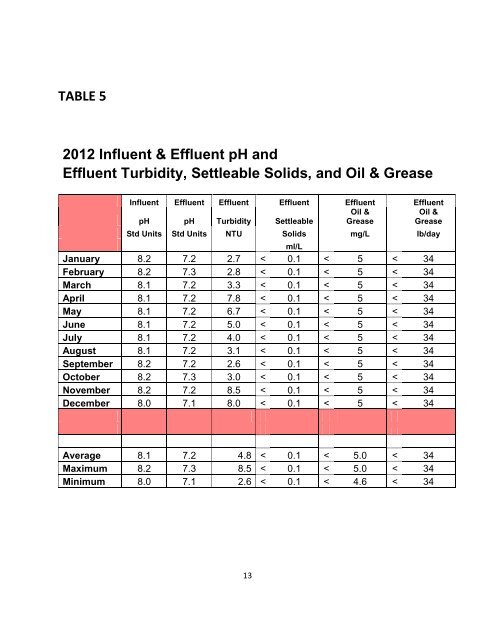
TABLE 5<br />
2012 Influent & Effluent pH and<br />
Effluent Turbidity, Settleable Solids, and Oil & Grease<br />
Influent Effluent Effluent Effluent Effluent Effluent<br />
Oil &<br />
Oil &<br />
pH pH Turbidity Settleable Grease<br />
Grease<br />
Std Units Std Units NTU Solids mg/L lb/day<br />
ml/L<br />
January 8.2 7.2 2.7 < 0.1 < 5 < 34<br />
February 8.2 7.3 2.8 < 0.1 < 5 < 34<br />
March 8.1 7.2 3.3 < 0.1 < 5 < 34<br />
April 8.1 7.2 7.8 < 0.1 < 5 < 34<br />
May 8.1 7.2 6.7 < 0.1 < 5 < 34<br />
June 8.1 7.2 5.0 < 0.1 < 5 < 34<br />
July 8.1 7.2 4.0 < 0.1 < 5 < 34<br />
August 8.1 7.2 3.1 < 0.1 < 5 < 34<br />
September 8.2 7.2 2.6 < 0.1 < 5 < 34<br />
October 8.2 7.3 3.0 < 0.1 < 5 < 34<br />
November 8.2 7.2 8.5 < 0.1 < 5 < 34<br />
December 8.0 7.1 8.0 < 0.1 < 5 < 34<br />
Average 8.1 7.2 4.8 < 0.1 < 5.0 < 34<br />
Maximum 8.2 7.3 8.5 < 0.1 < 5.0 < 34<br />
Minimum 8.0 7.1 2.6 < 0.1 < 4.6 < 34<br />
13