Wastewater Annual Report - City of Scotts Valley
Wastewater Annual Report - City of Scotts Valley
Wastewater Annual Report - City of Scotts Valley

Create successful ePaper yourself
Turn your PDF publications into a flip-book with our unique Google optimized e-Paper software.
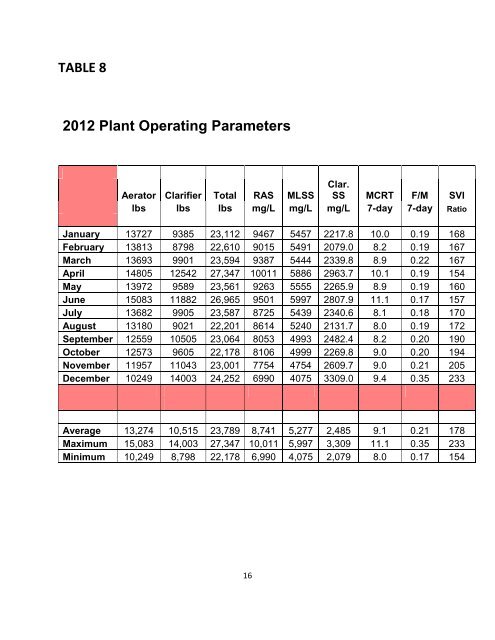
TABLE 8<br />
2012 Plant Operating Parameters<br />
Aerator Clarifier Total RAS MLSS<br />
Clar.<br />
SS MCRT F/M SVI<br />
lbs lbs lbs mg/L mg/L mg/L 7-day 7-day Ratio<br />
January 13727 9385 23,112 9467 5457 2217.8 10.0 0.19 168<br />
February 13813 8798 22,610 9015 5491 2079.0 8.2 0.19 167<br />
March 13693 9901 23,594 9387 5444 2339.8 8.9 0.22 167<br />
April 14805 12542 27,347 10011 5886 2963.7 10.1 0.19 154<br />
May 13972 9589 23,561 9263 5555 2265.9 8.9 0.19 160<br />
June 15083 11882 26,965 9501 5997 2807.9 11.1 0.17 157<br />
July 13682 9905 23,587 8725 5439 2340.6 8.1 0.18 170<br />
August 13180 9021 22,201 8614 5240 2131.7 8.0 0.19 172<br />
September 12559 10505 23,064 8053 4993 2482.4 8.2 0.20 190<br />
October 12573 9605 22,178 8106 4999 2269.8 9.0 0.20 194<br />
November 11957 11043 23,001 7754 4754 2609.7 9.0 0.21 205<br />
December 10249 14003 24,252 6990 4075 3309.0 9.4 0.35 233<br />
Average 13,274 10,515 23,789 8,741 5,277 2,485 9.1 0.21 178<br />
Maximum 15,083 14,003 27,347 10,011 5,997 3,309 11.1 0.35 233<br />
Minimum 10,249 8,798 22,178 6,990 4,075 2,079 8.0 0.17 154<br />
16