Wastewater Annual Report - City of Scotts Valley
Wastewater Annual Report - City of Scotts Valley
Wastewater Annual Report - City of Scotts Valley

You also want an ePaper? Increase the reach of your titles
YUMPU automatically turns print PDFs into web optimized ePapers that Google loves.
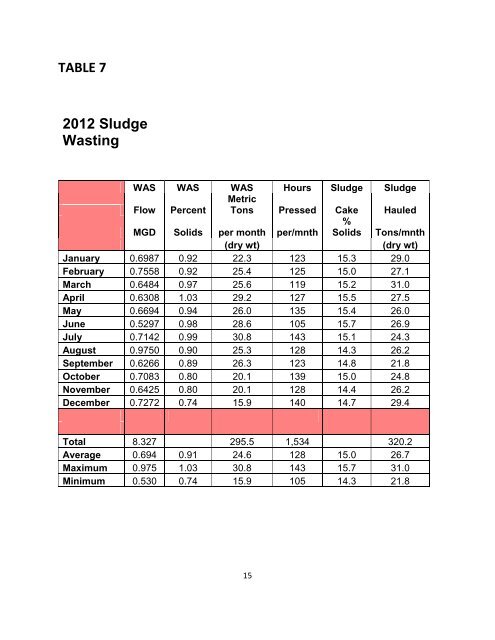
TABLE 7<br />
2012 Sludge<br />
Wasting<br />
WAS WAS WAS Hours Sludge Sludge<br />
Flow Percent<br />
Metric<br />
Tons Pressed Cake Hauled<br />
MGD Solids per month per/mnth<br />
%<br />
Solids Tons/mnth<br />
(dry wt)<br />
(dry wt)<br />
January 0.6987 0.92 22.3 123 15.3 29.0<br />
February 0.7558 0.92 25.4 125 15.0 27.1<br />
March 0.6484 0.97 25.6 119 15.2 31.0<br />
April 0.6308 1.03 29.2 127 15.5 27.5<br />
May 0.6694 0.94 26.0 135 15.4 26.0<br />
June 0.5297 0.98 28.6 105 15.7 26.9<br />
July 0.7142 0.99 30.8 143 15.1 24.3<br />
August 0.9750 0.90 25.3 128 14.3 26.2<br />
September 0.6266 0.89 26.3 123 14.8 21.8<br />
October 0.7083 0.80 20.1 139 15.0 24.8<br />
November 0.6425 0.80 20.1 128 14.4 26.2<br />
December 0.7272 0.74 15.9 140 14.7 29.4<br />
Total 8.327 295.5 1,534 320.2<br />
Average 0.694 0.91 24.6 128 15.0 26.7<br />
Maximum 0.975 1.03 30.8 143 15.7 31.0<br />
Minimum 0.530 0.74 15.9 105 14.3 21.8<br />
15