
Create successful ePaper yourself
Turn your PDF publications into a flip-book with our unique Google optimized e-Paper software.
Pulse and Digital Circuits Venkata Rao K., Rama Sudha K. and Manmadha Rao G.<br />
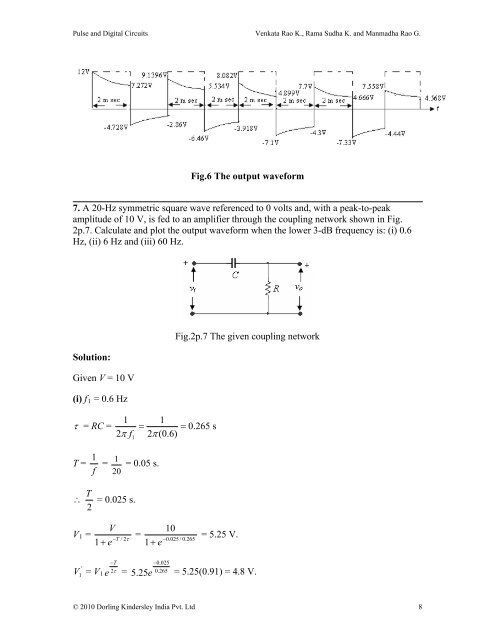
Fig.6 The output waveform<br />
7. A 20-Hz symmetric square wave referenced <strong>to</strong> 0 volts and, with a peak-<strong>to</strong>-peak<br />
amplitude of 10 V, is fed <strong>to</strong> an amplifier through the coupling network shown in Fig.<br />
2p.7. Calculate and plot the output waveform when the lower 3-dB frequency is: (i) 0.6<br />
Hz, (ii) 6 Hz and (iii) 60 Hz.<br />
Fig.2p.7 The given coupling network<br />
Solution:<br />
Given V = 10 V<br />
(i) f 1 = 0.6 Hz<br />
= RC =<br />
1 1<br />
0.265 s<br />
2<br />
f 2 (0.6)<br />
1<br />
1<br />
T = =<br />
1 = 0.05 s.<br />
f 20<br />
<br />
V 1 =<br />
T = 0.025 s.<br />
2<br />
V<br />
<br />
1<br />
e<br />
T<br />
/ 2<br />
10<br />
1 e<br />
=<br />
0.025 / 0. 265<br />
= 5.25 V.<br />
V = V 1 e<br />
'<br />
1<br />
T<br />
2<br />
0.025<br />
= 0. 265<br />
5.25e = 5.25(0.91) = 4.8 V.<br />
© 2010 Dorling Kindersley India Pvt. Ltd 8


![[Productnaam] Marketingplan - Pearson](https://img.yumpu.com/26285712/1/190x132/productnaam-marketingplan-pearson.jpg?quality=85)