Household Metabolism in the Five Cities.
Household Metabolism in the Five Cities.
Household Metabolism in the Five Cities.

Create successful ePaper yourself
Turn your PDF publications into a flip-book with our unique Google optimized e-Paper software.
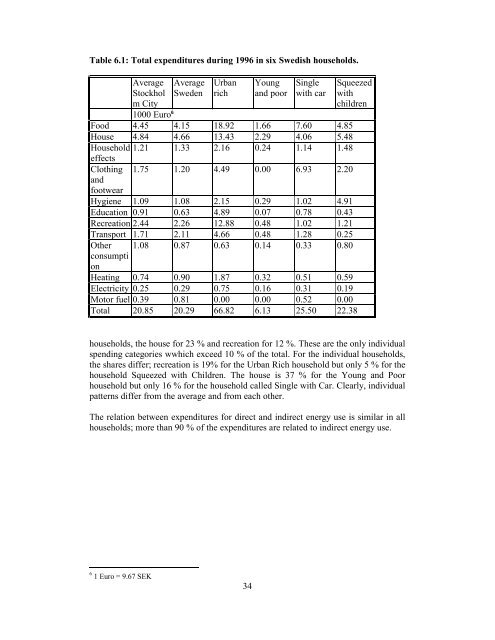
Table 6.1: Total expenditures dur<strong>in</strong>g 1996 <strong>in</strong> six Swedish households.<br />
Average<br />
Stockhol<br />
m City<br />
Average<br />
Sweden<br />
Urban<br />
rich<br />
Young<br />
and poor<br />
S<strong>in</strong>gle<br />
with car<br />
Squeezed<br />
with<br />
children<br />
1000 Euro 6<br />
Food 4.45 4.15 18.92 1.66 7.60 4.85<br />
House 4.84 4.66 13.43 2.29 4.06 5.48<br />
<strong>Household</strong> 1.21 1.33 2.16 0.24 1.14 1.48<br />
effects<br />
Cloth<strong>in</strong>g<br />
and<br />
footwear<br />
1.75 1.20 4.49 0.00 6.93 2.20<br />
Hygiene 1.09 1.08 2.15 0.29 1.02 4.91<br />
Education 0.91 0.63 4.89 0.07 0.78 0.43<br />
Recreation 2.44 2.26 12.88 0.48 1.02 1.21<br />
Transport 1.71 2.11 4.66 0.48 1.28 0.25<br />
O<strong>the</strong>r<br />
consumpti<br />
on<br />
1.08 0.87 0.63 0.14 0.33 0.80<br />
Heat<strong>in</strong>g 0.74 0.90 1.87 0.32 0.51 0.59<br />
Electricity 0.25 0.29 0.75 0.16 0.31 0.19<br />
Motor fuel 0.39 0.81 0.00 0.00 0.52 0.00<br />
Total 20.85 20.29 66.82 6.13 25.50 22.38<br />
households, <strong>the</strong> house for 23 % and recreation for 12 %. These are <strong>the</strong> only <strong>in</strong>dividual<br />
spend<strong>in</strong>g categories wwhich exceed 10 % of <strong>the</strong> total. For <strong>the</strong> <strong>in</strong>dividual households,<br />
<strong>the</strong> shares differ; recreation is 19% for <strong>the</strong> Urban Rich household but only 5 % for <strong>the</strong><br />
household Squeezed with Children. The house is 37 % for <strong>the</strong> Young and Poor<br />
household but only 16 % for <strong>the</strong> household called S<strong>in</strong>gle with Car. Clearly, <strong>in</strong>dividual<br />
patterns differ from <strong>the</strong> average and from each o<strong>the</strong>r.<br />
The relation between expenditures for direct and <strong>in</strong>direct energy use is similar <strong>in</strong> all<br />
households; more than 90 % of <strong>the</strong> expenditures are related to <strong>in</strong>direct energy use.<br />
6 1 Euro = 9.67 SEK<br />
34