Lintner Revisited: A Quantitative Analysis of Managed ... - CME Group
Lintner Revisited: A Quantitative Analysis of Managed ... - CME Group
Lintner Revisited: A Quantitative Analysis of Managed ... - CME Group

Create successful ePaper yourself
Turn your PDF publications into a flip-book with our unique Google optimized e-Paper software.
cmegroup.com<br />
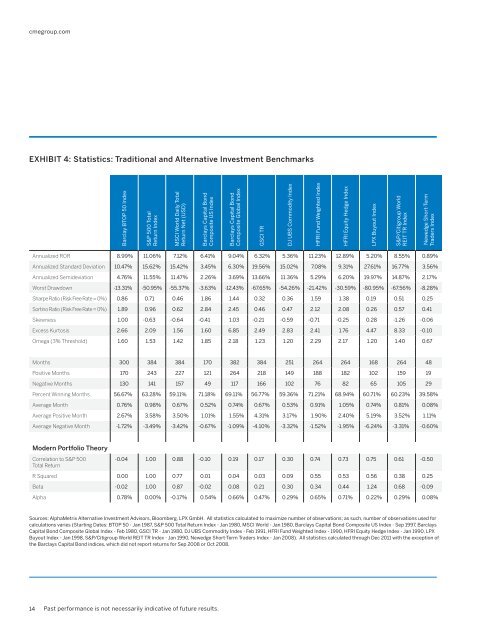
EXHIBIT 4: Statistics: Traditional and Alternative Investment Benchmarks<br />
Barclay BTOP 50 Index<br />
S&P 500 Total<br />
Return Index<br />
MSCI World Daily Total<br />
Return Net (USD)<br />
Barclays Capital Bond<br />
Composite US Index<br />
Barclays Capital Bond<br />
Composite Global Index<br />
GSCI TR<br />
DJ UBS Commodity Index<br />
HFRI Fund Weighted Index<br />
HFRI Equity Hedge Index<br />
LPX Buyout Index<br />
S&P/Citigroup World<br />
REIT TR Index<br />
Newedge Short-Term<br />
Traders Index<br />
Annualized ROR 8.99% 11.06% 7.12% 6.41% 9.04% 6.32% 5.36% 11.23% 12.89% 5.20% 8.55% 0.89%<br />
Annualized Standard Deviation 10.47% 15.62% 15.42% 3.45% 6.30% 19.56% 15.02% 7.08% 9.31% 27.61% 16.77% 3.56%<br />
Annualized Semideviation 4.76% 11.55% 11.47% 2.26% 3.69% 13.66% 11.36% 5.29% 6.20% 19.97% 14.87% 2.17%<br />
Worst Drawdown -13.31% -50.95% -55.37% -3.63% -12.43% -67.65% -54.26% -21.42% -30.59% -80.95% -67.56% -8.28%<br />
Sharpe Ratio (Risk Free Rate = 0%) 0.86 0.71 0.46 1.86 1.44 0.32 0.36 1.59 1.38 0.19 0.51 0.25<br />
Sortino Ratio (Risk Free Rate = 0%) 1.89 0.96 0.62 2.84 2.45 0.46 0.47 2.12 2.08 0.26 0.57 0.41<br />
Skewness 1.00 -0.63 -0.64 -0.41 1.03 -0.21 -0.59 -0.71 -0.25 0.28 -1.26 -0.06<br />
Excess Kurtosis 2.66 2.09 1.56 1.60 6.85 2.49 2.83 2.41 1.76 4.47 8.33 -0.10<br />
Omega (3% Threshold) 1.60 1.53 1.42 1.85 2.18 1.23 1.20 2.29 2.17 1.20 1.40 0.67<br />
Months 300 384 384 170 382 384 251 264 264 168 264 48<br />
Positive Months 170 243 227 121 264 218 149 188 182 102 159 19<br />
Negative Months 130 141 157 49 117 166 102 76 82 65 105 29<br />
Percent Winning Months 56.67% 63.28% 59.11% 71.18% 69.11% 56.77% 59.36% 71.21% 68.94% 60.71% 60.23% 39.58%<br />
Average Month 0.76% 0.98% 0.67% 0.52% 0.74% 0.67% 0.53% 0.91% 1.05% 0.74% 0.81% 0.08%<br />
Average Positive Month 2.67% 3.58% 3.50% 1.01% 1.55% 4.31% 3.17% 1.90% 2.40% 5.19% 3.52% 1.11%<br />
Average Negative Month -1.72% -3.49% -3.42% -0.67% -1.09% -4.10% -3.32% -1.52% -1.95% -6.24% -3.31% -0.60%<br />
Modern Portfolio Theory<br />
Correlation to S&P 500<br />
Total Return<br />
-0.04 1.00 0.88 -0.10 0.19 0.17 0.30 0.74 0.73 0.75 0.61 -0.50<br />
R Squared 0.00 1.00 0.77 0.01 0.04 0.03 0.09 0.55 0.53 0.56 0.38 0.25<br />
Beta -0.02 1.00 0.87 -0.02 0.08 0.21 0.30 0.34 0.44 1.24 0.68 -0.09<br />
Alpha 0.78% 0.00% -0.17% 0.54% 0.66% 0.47% 0.29% 0.65% 0.71% 0.22% 0.29% 0.08%<br />
Sources: AlphaMetrix Alternative Investment Advisors, Bloomberg, LPX GmbH. All statistics calculated to maximize number <strong>of</strong> observations; as such, number <strong>of</strong> observations used for<br />
calculations varies (Starting Dates: BTOP 50 - Jan 1987, S&P 500 Total Return Index - Jan 1980, MSCI World - Jan 1980, Barclays Capital Bond Composite US Index - Sep 1997, Barclays<br />
Capital Bond Composite Global Index - Feb 1980, GSCI TR - Jan 1980, DJ UBS Commodity Index - Feb 1991, HFRI Fund Weighted Index - 1990, HFRI Equity Hedge Index - Jan 1990, LPX<br />
Buyout Index - Jan 1998, S&P/Citigroup World REIT TR Index - Jan 1990, Newedge Short-Term Traders Index - Jan 2008). All statistics calculated through Dec 2011 with the exception <strong>of</strong><br />
the Barclays Capital Bond indices, which did not report returns for Sep 2008 or Oct 2008.<br />
14<br />
Past performance is not necessarily indicative <strong>of</strong> future results.


![Definitions & Concepts... [PDF] - Cycles Research Institute](https://img.yumpu.com/26387731/1/190x245/definitions-concepts-pdf-cycles-research-institute.jpg?quality=85)