Lintner Revisited: A Quantitative Analysis of Managed ... - CME Group
Lintner Revisited: A Quantitative Analysis of Managed ... - CME Group
Lintner Revisited: A Quantitative Analysis of Managed ... - CME Group

You also want an ePaper? Increase the reach of your titles
YUMPU automatically turns print PDFs into web optimized ePapers that Google loves.
cmegroup.com<br />
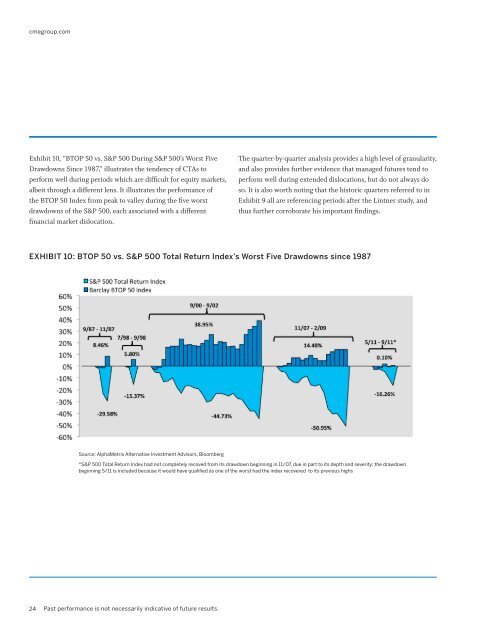
Exhibit 10, “BTOP 50 vs. S&P 500 During S&P 500’s Worst Five<br />
Drawdowns Since 1987,” illustrates the tendency <strong>of</strong> CTAs to<br />
perform well during periods which are difficult for equity markets,<br />
albeit through a different lens. It illustrates the performance <strong>of</strong><br />
the BTOP 50 Index from peak to valley during the five worst<br />
drawdowns <strong>of</strong> the S&P 500, each associated with a different<br />
financial market dislocation.<br />
The quarter-by-quarter analysis provides a high level <strong>of</strong> granularity,<br />
and also provides further evidence that managed futures tend to<br />
perform well during extended dislocations, but do not always do<br />
so. It is also worth noting that the historic quarters referred to in<br />
Exhibit 9 all are referencing periods after the <strong>Lintner</strong> study, and<br />
thus further corroborate his important findings.<br />
EXHIBIT 10: BTOP 50 vs. S&P 500 Total Return Index’s Worst Five Drawdowns since 1987<br />
Source: AlphaMetrix Alternative Investment Advisors, Bloomberg<br />
*S&P 500 Total Return Index had not completely recoved from its drawdown beginning in 11/07, due in part to its depth and severity; the drawdown<br />
beginning 5/11 is included because it would have qualified as one <strong>of</strong> the worst had the index recovered to its previous highs<br />
24<br />
Past performance is not necessarily indicative <strong>of</strong> future results.


![Definitions & Concepts... [PDF] - Cycles Research Institute](https://img.yumpu.com/26387731/1/190x245/definitions-concepts-pdf-cycles-research-institute.jpg?quality=85)