Lintner Revisited: A Quantitative Analysis of Managed ... - CME Group
Lintner Revisited: A Quantitative Analysis of Managed ... - CME Group
Lintner Revisited: A Quantitative Analysis of Managed ... - CME Group

You also want an ePaper? Increase the reach of your titles
YUMPU automatically turns print PDFs into web optimized ePapers that Google loves.
cmegroup.com<br />
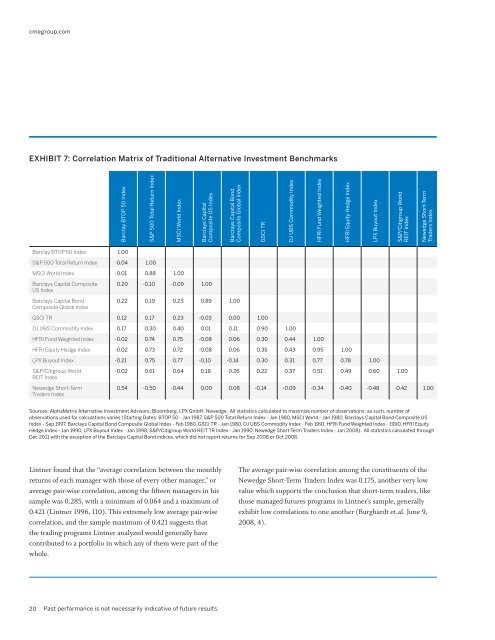
EXHIBIT 7: Correlation Matrix <strong>of</strong> Traditional Alternative Investment Benchmarks<br />
Barclay BTOP 50 Index<br />
S&P 500 Total Return Index<br />
MSCI World Index<br />
Barclays Capital<br />
Composite US Index<br />
Barclays Capital Bond<br />
Composite Global Index<br />
GSCI TR<br />
DJ UBS Commodity Index<br />
HFRI Fund Weighted Index<br />
HFRI Equity Hedge Index<br />
LPX Buyout Index<br />
S&P/Citigroup World<br />
REIT Index<br />
Newedge Short-Term<br />
Traders Index<br />
Barclay BTOP 50 Index 1.00<br />
S&P 500 Total Return Index -0.04 1.00<br />
MSCI World Index -0.01 0.88 1.00<br />
Barclays Capital Composite<br />
US Index<br />
Barclays Capital Bond<br />
Composite Global Index<br />
0.20 -0.10 -0.09 1.00<br />
0.22 0.19 0.23 0.89 1.00<br />
GSCI TR 0.12 0.17 0.23 -0.03 0.00 1.00<br />
DJ UBS Commodity Index 0.17 0.30 0.40 0.01 0.11 0.90 1.00<br />
HFRI Fund Weighted Index -0.02 0.74 0.75 -0.08 0.06 0.30 0.44 1.00<br />
HFRI Equity Hedge Index -0.02 0.73 0.72 -0.08 0.06 0.35 0.43 0.95 1.00<br />
LPX Buyout Index -0.21 0.75 0.77 -0.10 -0.14 0.30 0.31 0.77 0.78 1.00<br />
S&P/Citigroup World<br />
REIT Index<br />
Newedge Short-Term<br />
Traders Index<br />
-0.02 0.61 0.64 0.18 0.26 0.22 0.37 0.51 0.49 0.60 1.00<br />
0.54 -0.50 -0.44 0.00 0.08 -0.14 -0.09 -0.34 -0.40 -0.48 -0.42 1.00<br />
Sources: AlphaMetrix Alternative Investment Advisors, Bloomberg, LPX GmbH, Newedge. All statistics calculated to maximize number <strong>of</strong> observations; as such, number <strong>of</strong><br />
observations used for calculations varies (Starting Dates: BTOP 50 - Jan 1987, S&P 500 Total Return Index - Jan 1980, MSCI World - Jan 1980, Barclays Capital Bond Composite US<br />
Index - Sep 1997, Barclays Capital Bond Composite Global Index - Feb 1980, GSCI TR - Jan 1980, DJ UBS Commodity Index - Feb 1991, HFRI Fund Weighted Index - 1990, HFRI Equity<br />
Hedge Index - Jan 1990, LPX Buyout Index - Jan 1998, S&P/Citigroup World REIT TR Index - Jan 1990, Newedge Short-Term Traders Index - Jan 2008). All statistics calculated through<br />
Dec 2011 with the exception <strong>of</strong> the Barclays Capital Bond indices, which did not report returns for Sep 2008 or Oct 2008.<br />
<strong>Lintner</strong> found that the “average correlation between the monthly<br />
returns <strong>of</strong> each manager with those <strong>of</strong> every other manager,” or<br />
average pair-wise correlation, among the fifteen managers in his<br />
sample was 0.285, with a minimum <strong>of</strong> 0.064 and a maximum <strong>of</strong><br />
0.421 (<strong>Lintner</strong> 1996, 110). This extremely low average pair-wise<br />
correlation, and the sample maximum <strong>of</strong> 0.421 suggests that<br />
the trading programs <strong>Lintner</strong> analyzed would generally have<br />
contributed to a portfolio in which any <strong>of</strong> them were part <strong>of</strong> the<br />
whole.<br />
The average pair-wise correlation among the constituents <strong>of</strong> the<br />
Newedge Short-Term Traders Index was 0.175, another very low<br />
value which supports the conclusion that short-term traders, like<br />
those managed futures programs in <strong>Lintner</strong>’s sample, generally<br />
exhibit low correlations to one another (Burghardt et.al. June 9,<br />
2008, 4).<br />
20<br />
Past performance is not necessarily indicative <strong>of</strong> future results.
![Definitions & Concepts... [PDF] - Cycles Research Institute](https://img.yumpu.com/26387731/1/190x245/definitions-concepts-pdf-cycles-research-institute.jpg?quality=85)