Lintner Revisited: A Quantitative Analysis of Managed ... - CME Group
Lintner Revisited: A Quantitative Analysis of Managed ... - CME Group
Lintner Revisited: A Quantitative Analysis of Managed ... - CME Group

You also want an ePaper? Increase the reach of your titles
YUMPU automatically turns print PDFs into web optimized ePapers that Google loves.
cmegroup.com<br />
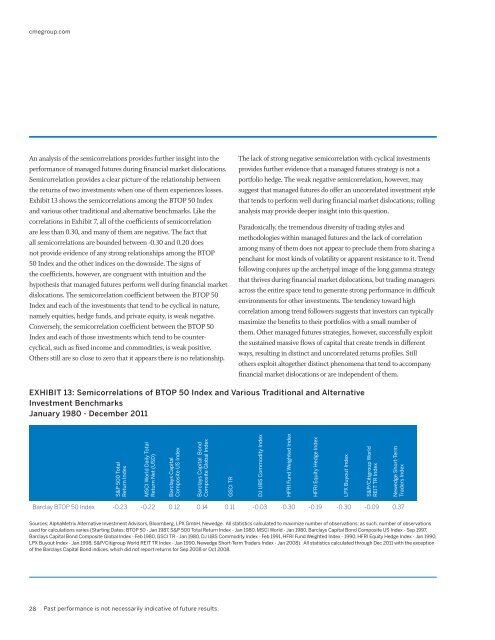
An analysis <strong>of</strong> the semicorrelations provides further insight into the<br />
performance <strong>of</strong> managed futures during financial market dislocations.<br />
Semicorrelation provides a clear picture <strong>of</strong> the relationship between<br />
the returns <strong>of</strong> two investments when one <strong>of</strong> them experiences losses.<br />
Exhibit 13 shows the semicorrelations among the BTOP 50 Index<br />
and various other traditional and alternative benchmarks. Like the<br />
correlations in Exhibit 7, all <strong>of</strong> the coefficients <strong>of</strong> semicorrelation<br />
are less than 0.30, and many <strong>of</strong> them are negative. The fact that<br />
all semicorrelations are bounded between -0.30 and 0.20 does<br />
not provide evidence <strong>of</strong> any strong relationships among the BTOP<br />
50 Index and the other indices on the downside. The signs <strong>of</strong><br />
the coefficients, however, are congruent with intuition and the<br />
hypothesis that managed futures perform well during financial market<br />
dislocations. The semicorrelation coefficient between the BTOP 50<br />
Index and each <strong>of</strong> the investments that tend to be cyclical in nature,<br />
namely equities, hedge funds, and private equity, is weak negative.<br />
Conversely, the semicorrelation coefficient between the BTOP 50<br />
Index and each <strong>of</strong> those investments which tend to be countercyclical,<br />
such as fixed income and commodities, is weak positive.<br />
Others still are so close to zero that it appears there is no relationship.<br />
The lack <strong>of</strong> strong negative semicorrelation with cyclical investments<br />
provides further evidence that a managed futures strategy is not a<br />
portfolio hedge. The weak negative semicorrelation, however, may<br />
suggest that managed futures do <strong>of</strong>fer an uncorrelated investment style<br />
that tends to perform well during financial market dislocations; rolling<br />
analysis may provide deeper insight into this question.<br />
Paradoxically, the tremendous diversity <strong>of</strong> trading styles and<br />
methodologies within managed futures and the lack <strong>of</strong> correlation<br />
among many <strong>of</strong> them does not appear to preclude them from sharing a<br />
penchant for most kinds <strong>of</strong> volatility or apparent resistance to it. Trend<br />
following conjures up the archetypal image <strong>of</strong> the long gamma strategy<br />
that thrives during financial market dislocations, but trading managers<br />
across the entire space tend to generate strong performance in difficult<br />
environments for other investments. The tendency toward high<br />
correlation among trend followers suggests that investors can typically<br />
maximize the benefits to their portfolios with a small number <strong>of</strong><br />
them. Other managed futures strategies, however, successfully exploit<br />
the sustained massive flows <strong>of</strong> capital that create trends in different<br />
ways, resulting in distinct and uncorrelated returns pr<strong>of</strong>iles. Still<br />
others exploit altogether distinct phenomena that tend to accompany<br />
financial market dislocations or are independent <strong>of</strong> them.<br />
EXHIBIT 13: Semicorrelations <strong>of</strong> BTOP 50 Index and Various Traditional and Alternative<br />
Investment Benchmarks<br />
January 1980 - December 2011<br />
S&P 500 Total<br />
Return Index<br />
MSCI World Daily Total<br />
Return Net (USD)<br />
Barclays Capital<br />
Composite US Index<br />
Barclays Capital Bond<br />
Composite Global Index<br />
GSCI TR<br />
DJ UBS Commodity Index<br />
HFRI Fund Weighted Index<br />
HFRI Equity Hedge Index<br />
LPX Buyout Index<br />
S&P/Citigroup World<br />
REIT TR Index<br />
Newedge Short-Term<br />
Traders Index<br />
Barclay BTOP 50 Index -0.23 -0.22 0.12 0.14 0.11 -0.03 -0.30 -0.19 -0.30 -0.09 0.37<br />
Sources: AlphaMetrix Alternative Investment Advisors, Bloomberg, LPX GmbH, Newedge. All statistics calculated to maximize number <strong>of</strong> observations; as such, number <strong>of</strong> observations<br />
used for calculations varies (Starting Dates: BTOP 50 - Jan 1987, S&P 500 Total Return Index - Jan 1980, MSCI World - Jan 1980, Barclays Capital Bond Composite US Index - Sep 1997,<br />
Barclays Capital Bond Composite Global Index - Feb 1980, GSCI TR - Jan 1980, DJ UBS Commodity Index - Feb 1991, HFRI Fund Weighted Index - 1990, HFRI Equity Hedge Index - Jan 1990,<br />
LPX Buyout Index - Jan 1998, S&P/Citigroup World REIT TR Index - Jan 1990, Newedge Short-Term Traders Index - Jan 2008). All statistics calculated through Dec 2011 with the exception<br />
<strong>of</strong> the Barclays Capital Bond indices, which did not report returns for Sep 2008 or Oct 2008.<br />
28<br />
Past performance is not necessarily indicative <strong>of</strong> future results.


![Definitions & Concepts... [PDF] - Cycles Research Institute](https://img.yumpu.com/26387731/1/190x245/definitions-concepts-pdf-cycles-research-institute.jpg?quality=85)