Consolidated Financial Statements 1st Semester 2009 - Sonae Sierra
Consolidated Financial Statements 1st Semester 2009 - Sonae Sierra
Consolidated Financial Statements 1st Semester 2009 - Sonae Sierra

You also want an ePaper? Increase the reach of your titles
YUMPU automatically turns print PDFs into web optimized ePapers that Google loves.
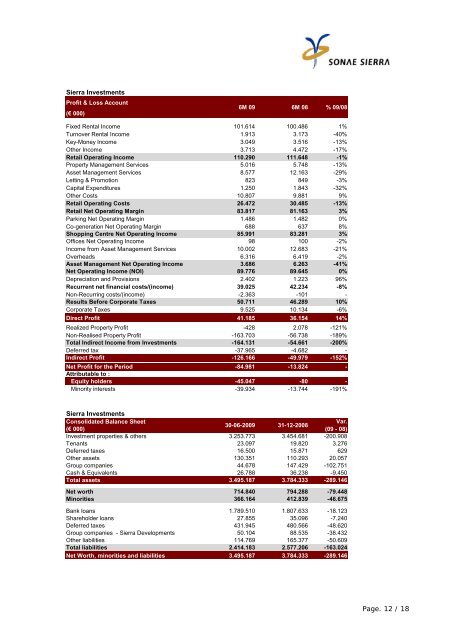
<strong>Sierra</strong> Investments<br />
Profit & Loss Account<br />
(€ 000)<br />
6M 09 6M 08 % 09/08<br />
Fixed Rental Income 101.614 100.486 1%<br />
Turnover Rental Income 1.913 3.173 -40%<br />
Key-Money Income 3.049 3.516 -13%<br />
Other Income 3.713 4.472 -17%<br />
Retail Operating Income 110.290 111.648 -1%<br />
Property Management Services 5.016 5.748 -13%<br />
Asset Management Services 8.577 12.163 -29%<br />
Letting & Promotion 823 849 -3%<br />
Capital Expenditures 1.250 1.843 -32%<br />
Other Costs 10.807 9.881 9%<br />
Retail Operating Costs 26.472 30.485 -13%<br />
Retail Net Operating Margin 83.817 81.163 3%<br />
Parking Net Operating Margin 1.486 1.482 0%<br />
Co-generation Net Operating Margin 688 637 8%<br />
Shopping Centre Net Operating Income 85.991 83.281 3%<br />
Offices Net Operating Income 98 100 -2%<br />
Income from Asset Management Services 10.002 12.683 -21%<br />
Overheads 6.316 6.419 -2%<br />
Asset Management Net Operating Income 3.686 6.263 -41%<br />
Net Operating Income (NOI) 89.776 89.645 0%<br />
Depreciation and Provisions 2.402 1.223 96%<br />
Recurrent net financial costs/(income) 39.025 42.234 -8%<br />
Non-Recurring costs/(income) -2.363 -101 -<br />
Results Before Corporate Taxes 50.711 46.289 10%<br />
Corporate Taxes 9.525 10.134 -6%<br />
Direct Profit 41.185 36.154 14%<br />
Realized Property Profit -428 2.078 -121%<br />
Non-Realised Property Profit -163.703 -56.738 -189%<br />
Total Indirect Income from Investments -164.131 -54.661 -200%<br />
Deferred tax -37.965 -4.682 -<br />
Indirect Profit -126.166 -49.979 -152%<br />
Net Profit for the Period -84.981 -13.824 -<br />
Attributable to :<br />
Equity holders -45.047 -80 -<br />
Minority interests -39.934 -13.744 -191%<br />
<strong>Sierra</strong> Investments<br />
<strong>Consolidated</strong> Balance Sheet<br />
Var.<br />
30-06-<strong>2009</strong> 31-12-2008<br />
(€ 000)<br />
(09 - 08)<br />
Investment properties & others 3.253.773 3.454.681 -200.908<br />
Tenants 23.097 19.820 3.276<br />
Deferred taxes 16.500 15.871 629<br />
Other assets 130.351 110.293 20.057<br />
Group companies 44.678 147.429 -102.751<br />
Cash & Equivalents 26.788 36.238 -9.450<br />
Total assets 3.495.187 3.784.333 -289.146<br />
Net worth 714.840 794.288 -79.448<br />
Minorities 366.164 412.839 -46.675<br />
Bank loans 1.789.510 1.807.633 -18.123<br />
Shareholder loans 27.855 35.096 -7.240<br />
Deferred taxes 431.945 480.566 -48.620<br />
Group companies - <strong>Sierra</strong> Developments 50.104 88.535 -38.432<br />
Other liabilities 114.769 165.377 -50.609<br />
Total liabilities 2.414.183 2.577.206 -163.024<br />
Net Worth, minorities and liabilities 3.495.187 3.784.333 -289.146<br />
Page. 12 / 18