SPSS macro for analyzing two-way interactions and simple slopes
SPSS macro for analyzing two-way interactions and simple slopes
SPSS macro for analyzing two-way interactions and simple slopes

Create successful ePaper yourself
Turn your PDF publications into a flip-book with our unique Google optimized e-Paper software.
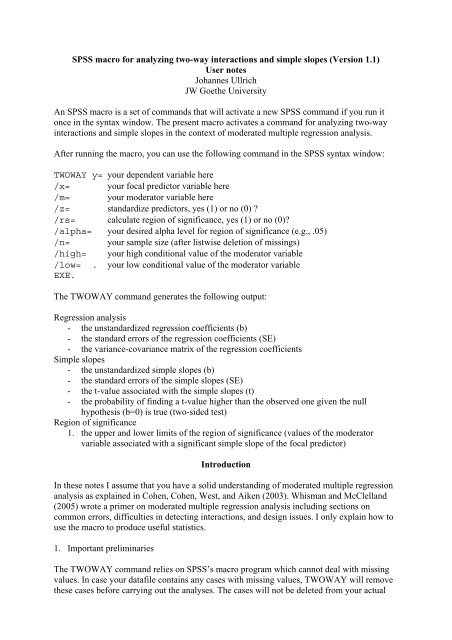
<strong>SPSS</strong> <strong>macro</strong> <strong>for</strong> <strong>analyzing</strong> <strong>two</strong>-<strong>way</strong> <strong>interactions</strong> <strong>and</strong> <strong>simple</strong> <strong>slopes</strong> (Version 1.1)<br />
User notes<br />
Johannes Ullrich<br />
JW Goethe University<br />
An <strong>SPSS</strong> <strong>macro</strong> is a set of comm<strong>and</strong>s that will activate a new <strong>SPSS</strong> comm<strong>and</strong> if you run it<br />
once in the syntax window. The present <strong>macro</strong> activates a comm<strong>and</strong> <strong>for</strong> <strong>analyzing</strong> <strong>two</strong>-<strong>way</strong><br />
<strong>interactions</strong> <strong>and</strong> <strong>simple</strong> <strong>slopes</strong> in the context of moderated multiple regression analysis.<br />
After running the <strong>macro</strong>, you can use the following comm<strong>and</strong> in the <strong>SPSS</strong> syntax window:<br />
TWOWAY y= your dependent variable here<br />
/x= your focal predictor variable here<br />
/m= your moderator variable here<br />
/z= st<strong>and</strong>ardize predictors, yes (1) or no (0) ?<br />
/rs= calculate region of significance, yes (1) or no (0)?<br />
/alpha= your desired alpha level <strong>for</strong> region of significance (e.g., .05)<br />
/n= your sample size (after listwise deletion of missings)<br />
/high= your high conditional value of the moderator variable<br />
/low= . your low conditional value of the moderator variable<br />
EXE.<br />
The TWOWAY comm<strong>and</strong> generates the following output:<br />
Regression analysis<br />
- the unst<strong>and</strong>ardized regression coefficients (b)<br />
- the st<strong>and</strong>ard errors of the regression coefficients (SE)<br />
- the variance-covariance matrix of the regression coefficients<br />
Simple <strong>slopes</strong><br />
- the unst<strong>and</strong>ardized <strong>simple</strong> <strong>slopes</strong> (b)<br />
- the st<strong>and</strong>ard errors of the <strong>simple</strong> <strong>slopes</strong> (SE)<br />
- the t-value associated with the <strong>simple</strong> <strong>slopes</strong> (t)<br />
- the probability of finding a t-value higher than the observed one given the null<br />
hypothesis (b=0) is true (<strong>two</strong>-sided test)<br />
Region of significance<br />
1. the upper <strong>and</strong> lower limits of the region of significance (values of the moderator<br />
variable associated with a significant <strong>simple</strong> slope of the focal predictor)<br />
Introduction<br />
In these notes I assume that you have a solid underst<strong>and</strong>ing of moderated multiple regression<br />
analysis as explained in Cohen, Cohen, West, <strong>and</strong> Aiken (2003). Whisman <strong>and</strong> McClell<strong>and</strong><br />
(2005) wrote a primer on moderated multiple regression analysis including sections on<br />
common errors, difficulties in detecting <strong>interactions</strong>, <strong>and</strong> design issues. I only explain how to<br />
use the <strong>macro</strong> to produce useful statistics.<br />
1. Important preliminaries<br />
The TWOWAY comm<strong>and</strong> relies on <strong>SPSS</strong>’s <strong>macro</strong> program which cannot deal with missing<br />
values. In case your datafile contains any cases with missing values, TWOWAY will remove<br />
these cases be<strong>for</strong>e carrying out the analyses. The cases will not be deleted from your actual
datafile, but only from the temporary datafile created by TWOWAY. However, TWOWAY<br />
will only recognize missing values that appear as , or . in the spreadsheet. Make sure that your<br />
datafile does not contain any user-defined missing values such as 99, because these will be<br />
treated as real data! For instance, use the comm<strong>and</strong> RECODE variable (99=sysmis).<br />
2. Using the comm<strong>and</strong>, Example #1<br />
This section explains the st<strong>and</strong>ard case where you would st<strong>and</strong>ardize predictor variables <strong>and</strong><br />
calculate the <strong>simple</strong> <strong>slopes</strong> at 1 SD below/above the mean of the moderator variable.<br />
In this example I assume that you have opened an <strong>SPSS</strong> file that contains three variables:<br />
Your dependent variable, your focal predictor variable, <strong>and</strong> your moderator variable. In order<br />
to use TWOWAY, you first have to activate the <strong>macro</strong>. Run it once in the syntax window.<br />
Now you can use the TWOWAY comm<strong>and</strong> as normal <strong>SPSS</strong> syntax. In most applications, it<br />
will be desirable to st<strong>and</strong>ardize the predictor variables (i.e., mean = 0, SD = 1) be<strong>for</strong>e<br />
computing the product term. With st<strong>and</strong>ardized predictors, it is more convenient to interpret<br />
the regression coefficients <strong>and</strong> create an interaction plot (see Cohen et al., 2003; Whisman &<br />
McClell<strong>and</strong>, 2005). There<strong>for</strong>e, TWOWAY includes a comm<strong>and</strong> to st<strong>and</strong>ardize variables.<br />
Say your interested in the effect of ability (ABIL) on per<strong>for</strong>mance (PERFORM), depending<br />
on motivation (MOT). The minimum input required <strong>for</strong> TWOWAY to work is the following:<br />
TWOWAY y= PERFORM /x= ABIL /m= MOT /z= 1.<br />
EXE.<br />
Given this input, TWOWAY will first st<strong>and</strong>ardize ABIL <strong>and</strong> MOT, compute the product of<br />
the st<strong>and</strong>ardized variables, <strong>and</strong> then do an ordinary least squares regression based on these<br />
newly generated variables. The <strong>simple</strong> <strong>slopes</strong> printed in the output are those associated with<br />
conditional values of 1 SD above/below the mean of the moderator variable. These<br />
conditional values are often used <strong>for</strong> lack of a more theoretically driven value. If you would<br />
like to use other conditional values or do not want st<strong>and</strong>ardized predictors variables, see<br />
Example #2. If you are unsatisfied with using 1 SD above/below the mean as conditional<br />
values, but do not have more meaningful values, maybe the region of significance is what<br />
you’re interested in.<br />
A region of significance indicates „the points on the scale of the moderator at which the effect<br />
of the focal predictor passes from significance to nonsignificance at the selected alpha-level“<br />
(Bauer & Curran, 2005, p.380). TWOWAY employs equation (21) in Bauer <strong>and</strong> Curran<br />
(2005) to calculate the limits of the region of significance. If you would like to print the<br />
region of significance, you have to set rs to 1, specify your alpha-level <strong>and</strong> the sample size<br />
(after listwise exclusion of missings, see above). Say we’re interested in the range of MOT<br />
over which ABIL is related to PERFORM, <strong>and</strong> we’re using an alpha level of .05 with an<br />
effective sample size of n = 100. The following syntax will give us the region of significance:<br />
TWOWAY y= PERFORM /x= ABIL /m= MOT /z= 1 /rs= 1 /alpha= .05 /n<br />
= 100.<br />
EXE.<br />
3. Using the comm<strong>and</strong>, Example #2
For several reasons you might want to toggle the st<strong>and</strong>ardize comm<strong>and</strong> off (z=0). For<br />
instance, you may have more meaningful conditional values than 1 SD above/below the mean<br />
or do not want to st<strong>and</strong>ardize predictors because at least one of your predictors is a binary<br />
grouping variable. Cohen <strong>and</strong> his coauthors (2003) describe several useful coding schemes <strong>for</strong><br />
grouping variables.<br />
If you toggle the st<strong>and</strong>ardize comm<strong>and</strong> off, make sure your predictor variables are coded<br />
appropriately <strong>and</strong> specify the high <strong>and</strong> low conditional values. For instance, say the MOT<br />
variable from Example #1 carries in<strong>for</strong>mation about whether a given participant was in the<br />
experimental (=high motivation) or control (=low motivation) group. If you have coded MOT<br />
as 1 <strong>for</strong> experimental <strong>and</strong> 0 <strong>for</strong> control, you can use the following comm<strong>and</strong> to determine the<br />
<strong>simple</strong> <strong>slopes</strong> of ABIL within the experimental <strong>and</strong> control groups:<br />
TWOWAY y= PERFORM /x= ABIL /m= MOT /z= 0 /high= 1 /low= 0.<br />
EXE.<br />
The output will be based on analyses carried out with the raw variables as they appear in your<br />
spreadsheet.<br />
The region of significance comm<strong>and</strong> will also work with z=0, but it may not make much<br />
sense when you use a binary moderator variable.<br />
4. Plotting <strong>interactions</strong><br />
Although the TWOWAY <strong>macro</strong> can facilitate your analyses of <strong>two</strong>-<strong>way</strong> <strong>interactions</strong>, it cannot<br />
produce plots of these. Other useful interaction tools are available on the internet (especially<br />
<strong>for</strong> plotting):<br />
http://www.psych.ku.edu/preacher/<br />
http://www.jeremydawson.co.uk/<strong>slopes</strong>.htm<br />
5. Future versions<br />
If you have suggestions <strong>for</strong> improving the TWOWAY <strong>macro</strong>, contact me under<br />
ullrich@psych.uni-frankfurt.de. Future versions of the <strong>macro</strong> will appear on<br />
www.psychologie.uni-frankfurt.de/Abteil/sozial<br />
References<br />
Bauer, D. J., & Curran, P. J. (2005). Probing <strong>interactions</strong> in fixed an multilevel regression:<br />
Inferential <strong>and</strong> graphical techniques. Multivariate Behavioral Research, 40, 373-400.<br />
Cohen, J., Cohen, P., West, S. G., & Aiken, L. S. (2003). Applied multiple<br />
regression/correlation analysis <strong>for</strong> the behavioral sciences (3rd ed.). Mahwah, NJ:<br />
Lawrence Erlbaum Associates.<br />
Whisman, M. A., & McClell<strong>and</strong>, G. H. (2005). Designing, testing, <strong>and</strong> interpreting<br />
<strong>interactions</strong> <strong>and</strong> moderator effects in family research. Journal of Family Psychology, 19,<br />
111-120.