Experimental - Spectroscopy
Experimental - Spectroscopy
Experimental - Spectroscopy

Create successful ePaper yourself
Turn your PDF publications into a flip-book with our unique Google optimized e-Paper software.
22 <strong>Spectroscopy</strong> 26(6) June 2011 www.spectroscopyonline.com<br />
Chemometrics in <strong>Spectroscopy</strong><br />
Classical Least Squares, Part VI:<br />
Spectral Results<br />
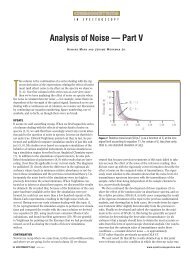
We continue to examine in detail the spectral behavior of three-component mixtures.<br />
Howard Mark and Jerome Workman, Jr.<br />
This column is the continuation of our discussion of<br />
the classical least squares approach to calibration<br />
(1–5). In this installment, as in the previous one (5),<br />
we will be dealing largely with figures, and the spectra<br />
therein. So far, we have looked at the spectra of the pure<br />
components comprising the ternary mixtures we are<br />
working with. We also have looked at the spectra of all<br />
the mixtures overlaid on each other.<br />
One important reason to perform this extensive exercise<br />
of examining spectra is to address, and hopefully<br />
clear up, a misconception some people have about nearinfrared<br />
(NIR) spectra. Because of its history, NIR spectroscopy<br />
sometimes is believed to rely on, and require,<br />
the “magic” of chemometric analysis to obtain meaningful<br />
scientific results. But that’s not always true. That perception<br />
has arisen because NIR measurements most often<br />
are made on samples that are powdered solids, part of a<br />
dynamic mechanism, or involve other difficult conditions<br />
that often make other types of spectral measurements<br />
impossible.<br />
This has created an impression that NIR exists in a<br />
Celebrating 25 Years<br />
The editors congratulate Howard Mark and<br />
Jerry Workman for 25 years of statistics and<br />
chemometrics columns in <strong>Spectroscopy</strong>.<br />
universe of its own, disconnected from the rest of science.<br />
Therefore, we take this opportunity to emphasize<br />
(and maybe overemphasize) the fact that NIR is not some<br />
“magical” technique that is different from the rest of the<br />
universe, but in fact is the same spectroscopy we are all<br />
used to seeing in other spectral regions. When samples<br />
are presented to a spectrometer, they behave the same<br />
way in the NIR as they do in the UV, visible, mid-IR, or<br />
any other region.<br />
In the current experiment, we have a situation where<br />
clear liquid samples are used, and measured in a cuvette<br />
having plane parallel windows — the near-ideal conditions<br />
that are normally used for any spectral region. In<br />
this way, we can demonstrate that NIR spectra, under<br />
those conditions, do indeed behave the same way as spectra<br />
in other spectral regions do.<br />
Let us look at the three sets of two-component mixtures<br />
that the experimental design includes. These are<br />
presented in Figures 1–3. In these figures, we first present<br />
the full spectrum, and then for each mixture we present<br />
the spectra of the mixtures in the several subranges that<br />
contain the useful absorbance bands.<br />
Examining these spectra, we see some features that<br />
were partially obscured when the spectra from all the<br />
mixtures were plotted together. One effect that was<br />
hidden by the overlapping spectra was the presence of<br />
isosbestic points. Although Figure 5e from part V of this<br />
column series (5) shows a ternary isosbestic point, that<br />
is rare; for the most part isosbestic points are not seen