Experimental - Spectroscopy
Experimental - Spectroscopy
Experimental - Spectroscopy

You also want an ePaper? Increase the reach of your titles
YUMPU automatically turns print PDFs into web optimized ePapers that Google loves.
www.spectroscopyonline.com June 2011 <strong>Spectroscopy</strong> 26(6) 39<br />
Raman and SERS spectra were recorded<br />
with a Raman microscopic spectrometer<br />
(Renishaw RM-1000, New Mills, United<br />
Kingdom) composed of an optical microscope,<br />
a CCD video camera, and a spectrometer.<br />
A 632.8-nm HeNe laser was<br />
used as the excitation source. The SERS<br />
spectra of the probed molecules were measured<br />
with an accumulation time of 10 s<br />
using a 20× object lens. The laser power<br />
focused on the sample was ~5 mW, and the<br />
spectral resolution was set to 3 cm -1 . The<br />
analysis of the spectra for all pH values<br />
was performed by nonlinear curve fitting<br />
using Origin 7.0 software (OriginLab Corporation,<br />
Northampton, Massachusetts).<br />
Curve fitting was carried out considering<br />
the band as a Lorentzian curve.<br />
(a)<br />
(b)<br />
Results and Discussion<br />
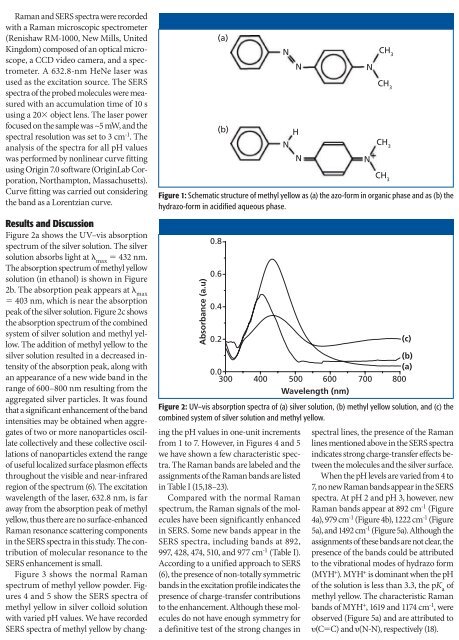
Figure 2a shows the UV–vis absorption<br />
spectrum of the silver solution. The silver<br />
solution absorbs light at λ max<br />
= 432 nm.<br />
The absorption spectrum of methyl yellow<br />
solution (in ethanol) is shown in Figure<br />
2b. The absorption peak appears at λ max<br />
= 403 nm, which is near the absorption<br />
peak of the silver solution. Figure 2c shows<br />
the absorption spectrum of the combined<br />
system of silver solution and methyl yellow.<br />
The addition of methyl yellow to the<br />
silver solution resulted in a decreased intensity<br />
of the absorption peak, along with<br />
an appearance of a new wide band in the<br />
range of 600–800 nm resulting from the<br />
aggregated silver particles. It was found<br />
that a significant enhancement of the band<br />
intensities may be obtained when aggregates<br />
of two or more nanoparticles oscillate<br />
collectively and these collective oscillations<br />
of nanoparticles extend the range<br />
of useful localized surface plasmon effects<br />
throughout the visible and near-infrared<br />
region of the spectrum (6). The excitation<br />
wavelength of the laser, 632.8 nm, is far<br />
away from the absorption peak of methyl<br />
yellow, thus there are no surface-enhanced<br />
Raman resonance scattering components<br />
in the SERS spectra in this study. The contribution<br />
of molecular resonance to the<br />
SERS enhancement is small.<br />
Figure 3 shows the normal Raman<br />
spectrum of methyl yellow powder. Figures<br />
4 and 5 show the SERS spectra of<br />
methyl yellow in silver colloid solution<br />
with varied pH values. We have recorded<br />
SERS spectra of methyl yellow by changing<br />
the pH values in one-unit increments<br />
from 1 to 7. However, in Figures 4 and 5<br />
we have shown a few characteristic spectra.<br />
The Raman bands are labeled and the<br />
assignments of the Raman bands are listed<br />
in Table I (15,18–23).<br />
Compared with the normal Raman<br />
spectrum, the Raman signals of the molecules<br />
have been significantly enhanced<br />
in SERS. Some new bands appear in the<br />
SERS spectra, including bands at 892,<br />
997, 428, 474, 510, and 977 cm -1 (Table I).<br />
According to a unified approach to SERS<br />
(6), the presence of non-totally symmetric<br />
bands in the excitation profile indicates the<br />
presence of charge-transfer contributions<br />
to the enhancement. Although these molecules<br />
do not have enough symmetry for<br />
a definitive test of the strong changes in<br />
N<br />
N<br />
N<br />
H<br />
N<br />
Figure 1: Schematic structure of methyl yellow as (a) the azo-form in organic phase and as (b) the<br />
hydrazo-form in acidified aqueous phase.<br />
Absorbance (a.u)<br />
0.8<br />
0.6<br />
0.4<br />
0.2<br />
N<br />
N<br />
CH 3<br />
CH 3<br />
CH 3<br />
CH 3<br />
(b)<br />
(a)<br />
0.0<br />
300 400 500 600 700 800<br />
Wavelength (nm)<br />
Figure 2: UV–vis absorption spectra of (a) silver solution, (b) methyl yellow solution, and (c) the<br />
combined system of silver solution and methyl yellow.<br />
(c)<br />
spectral lines, the presence of the Raman<br />
lines mentioned above in the SERS spectra<br />
indicates strong charge-transfer effects between<br />
the molecules and the silver surface.<br />
When the pH levels are varied from 4 to<br />
7, no new Raman bands appear in the SERS<br />
spectra. At pH 2 and pH 3, however, new<br />
Raman bands appear at 892 cm -1 (Figure<br />
4a), 979 cm -1 (Figure 4b), 1222 cm -1 (Figure<br />
5a), and 1492 cm -1 (Figure 5a). Although the<br />
assignments of these bands are not clear, the<br />
presence of the bands could be attributed<br />
to the vibrational modes of hydrazo form<br />
(MYH + ). MYH + is dominant when the pH<br />
of the solution is less than 3.3, the pK a<br />
of<br />
methyl yellow. The characteristic Raman<br />
bands of MYH + , 1619 and 1174 cm -1 , were<br />
observed (Figure 5a) and are attributed to<br />
υ(C=C) and υ(N-N), respectively (18).