Experimental - Spectroscopy
Experimental - Spectroscopy
Experimental - Spectroscopy

Create successful ePaper yourself
Turn your PDF publications into a flip-book with our unique Google optimized e-Paper software.
www.spectroscopyonline.com<br />
June 2011 <strong>Spectroscopy</strong> 26(6) 25<br />
(a)<br />
Transmittance<br />
1<br />
0.8<br />
0.6<br />
0.4<br />
0.2<br />
(b) 0.9<br />
0.8<br />
0.7<br />
0.6<br />
0.5<br />
0.4<br />
0.3<br />
0.2<br />
Transmittance<br />
0<br />
-0.2<br />
4000 5000 6000 7000 8000 9000 10,000<br />
Wavelength<br />
0.1<br />
0<br />
-0.1<br />
4000 4100 4200 4300 4400 4500 4600 4700 4800 4900 5000<br />
Wavelength<br />
(c) 0.1<br />
0.9<br />
(d)<br />
1<br />
0.95<br />
Transmittance<br />
0.8<br />
0.7<br />
0.6<br />
0.5<br />
0.4<br />
0.3<br />
0.2<br />
0.1<br />
Transmittance<br />
0.9<br />
0.85<br />
0.8<br />
0.75<br />
0.7<br />
0.65<br />
5000 5500 6000 6500<br />
Wavelength<br />
(e) 1<br />
6500 6600 6700 6800 6900 7000 7100 7200 7300 7400 7500<br />
Wavelength<br />
0.95<br />
0.9<br />
Transmittance<br />
0.85<br />
0.8<br />
0.75<br />
0.7<br />
0.65<br />
7500 8000 8500 9000<br />
Wavelength<br />
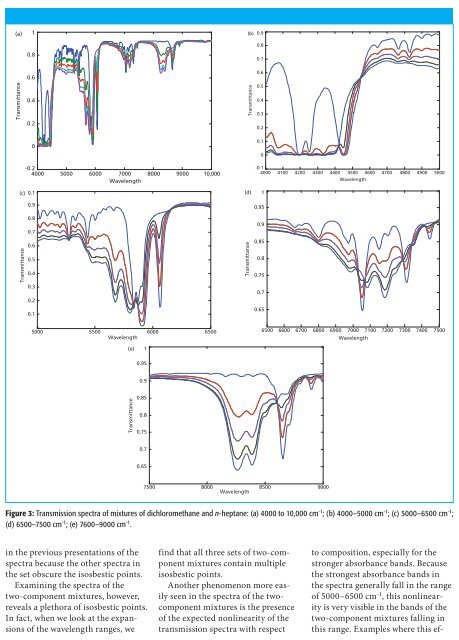
Figure 3: Transmission spectra of mixtures of dichloromethane and n-heptane: (a) 4000 to 10,000 cm -1 ; (b) 4000–5000 cm -1 ; (c) 5000–6500 cm -1 ;<br />
(d) 6500–7500 cm -1 ; (e) 7600–9000 cm -1 .<br />
in the previous presentations of the<br />
spectra because the other spectra in<br />
the set obscure the isosbestic points.<br />
Examining the spectra of the<br />
two-component mixtures, however,<br />
reveals a plethora of isosbestic points.<br />
In fact, when we look at the expansions<br />
of the wavelength ranges, we<br />
find that all three sets of two-component<br />
mixtures contain multiple<br />
isosbestic points.<br />
Another phenomenon more easily<br />
seen in the spectra of the twocomponent<br />
mixtures is the presence<br />
of the expected nonlinearity of the<br />
transmission spectra with respect<br />
to composition, especially for the<br />
stronger absorbance bands. Because<br />
the strongest absorbance bands in<br />
the spectra generally fall in the range<br />
of 5000–6500 cm -1 , this nonlinearity<br />
is very visible in the bands of the<br />
two-component mixtures falling in<br />
this range. Examples where this ef-