EOP Historical Tables of the U.S. Budget - Social Sciences Division
EOP Historical Tables of the U.S. Budget - Social Sciences Division
EOP Historical Tables of the U.S. Budget - Social Sciences Division

Create successful ePaper yourself
Turn your PDF publications into a flip-book with our unique Google optimized e-Paper software.
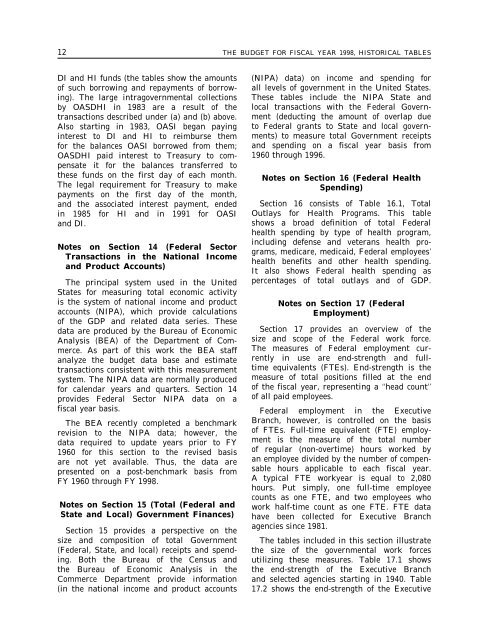
12 THE BUDGET FOR FISCAL YEAR 1998, HISTORICAL TABLES<br />
DI and HI funds (<strong>the</strong> tables show <strong>the</strong> amounts<br />
<strong>of</strong> such borrowing and repayments <strong>of</strong> borrowing).<br />
The large intragovernmental collections<br />
by OASDHI in 1983 are a result <strong>of</strong> <strong>the</strong><br />
transactions described under (a) and (b) above.<br />
Also starting in 1983, OASI began paying<br />
interest to DI and HI to reimburse <strong>the</strong>m<br />
for <strong>the</strong> balances OASI borrowed from <strong>the</strong>m;<br />
OASDHI paid interest to Treasury to compensate<br />
it for <strong>the</strong> balances transferred to<br />
<strong>the</strong>se funds on <strong>the</strong> first day <strong>of</strong> each month.<br />
The legal requirement for Treasury to make<br />
payments on <strong>the</strong> first day <strong>of</strong> <strong>the</strong> month,<br />
and <strong>the</strong> associated interest payment, ended<br />
in 1985 for HI and in 1991 for OASI<br />
and DI.<br />
Notes on Section 14 (Federal Sector<br />
Transactions in <strong>the</strong> National Income<br />
and Product Accounts)<br />
The principal system used in <strong>the</strong> United<br />
States for measuring total economic activity<br />
is <strong>the</strong> system <strong>of</strong> national income and product<br />
accounts (NIPA), which provide calculations<br />
<strong>of</strong> <strong>the</strong> GDP and related data series. These<br />
data are produced by <strong>the</strong> Bureau <strong>of</strong> Economic<br />
Analysis (BEA) <strong>of</strong> <strong>the</strong> Department <strong>of</strong> Commerce.<br />
As part <strong>of</strong> this work <strong>the</strong> BEA staff<br />
analyze <strong>the</strong> budget data base and estimate<br />
transactions consistent with this measurement<br />
system. The NIPA data are normally produced<br />
for calendar years and quarters. Section 14<br />
provides Federal Sector NIPA data on a<br />
fiscal year basis.<br />
The BEA recently completed a benchmark<br />
revision to <strong>the</strong> NIPA data; however, <strong>the</strong><br />
data required to update years prior to FY<br />
1960 for this section to <strong>the</strong> revised basis<br />
are not yet available. Thus, <strong>the</strong> data are<br />
presented on a post-benchmark basis from<br />
FY 1960 through FY 1998.<br />
Notes on Section 15 (Total (Federal and<br />
State and Local) Government Finances)<br />
Section 15 provides a perspective on <strong>the</strong><br />
size and composition <strong>of</strong> total Government<br />
(Federal, State, and local) receipts and spending.<br />
Both <strong>the</strong> Bureau <strong>of</strong> <strong>the</strong> Census and<br />
<strong>the</strong> Bureau <strong>of</strong> Economic Analysis in <strong>the</strong><br />
Commerce Department provide information<br />
(in <strong>the</strong> national income and product accounts<br />
(NIPA) data) on income and spending for<br />
all levels <strong>of</strong> government in <strong>the</strong> United States.<br />
These tables include <strong>the</strong> NIPA State and<br />
local transactions with <strong>the</strong> Federal Government<br />
(deducting <strong>the</strong> amount <strong>of</strong> overlap due<br />
to Federal grants to State and local governments)<br />
to measure total Government receipts<br />
and spending on a fiscal year basis from<br />
1960 through 1996.<br />
Notes on Section 16 (Federal Health<br />
Spending)<br />
Section 16 consists <strong>of</strong> Table 16.1, Total<br />
Outlays for Health Programs. This table<br />
shows a broad definition <strong>of</strong> total Federal<br />
health spending by type <strong>of</strong> health program,<br />
including defense and veterans health programs,<br />
medicare, medicaid, Federal employees’<br />
health benefits and o<strong>the</strong>r health spending.<br />
It also shows Federal health spending as<br />
percentages <strong>of</strong> total outlays and <strong>of</strong> GDP.<br />
Notes on Section 17 (Federal<br />
Employment)<br />
Section 17 provides an overview <strong>of</strong> <strong>the</strong><br />
size and scope <strong>of</strong> <strong>the</strong> Federal work force.<br />
The measures <strong>of</strong> Federal employment currently<br />
in use are end-strength and fulltime<br />
equivalents (FTEs). End-strength is <strong>the</strong><br />
measure <strong>of</strong> total positions filled at <strong>the</strong> end<br />
<strong>of</strong> <strong>the</strong> fiscal year, representing a ‘‘head count’’<br />
<strong>of</strong> all paid employees.<br />
Federal employment in <strong>the</strong> Executive<br />
Branch, however, is controlled on <strong>the</strong> basis<br />
<strong>of</strong> FTEs. Full-time equivalent (FTE) employment<br />
is <strong>the</strong> measure <strong>of</strong> <strong>the</strong> total number<br />
<strong>of</strong> regular (non-overtime) hours worked by<br />
an employee divided by <strong>the</strong> number <strong>of</strong> compensable<br />
hours applicable to each fiscal year.<br />
A typical FTE workyear is equal to 2,080<br />
hours. Put simply, one full-time employee<br />
counts as one FTE, and two employees who<br />
work half-time count as one FTE. FTE data<br />
have been collected for Executive Branch<br />
agencies since 1981.<br />
The tables included in this section illustrate<br />
<strong>the</strong> size <strong>of</strong> <strong>the</strong> governmental work forces<br />
utilizing <strong>the</strong>se measures. Table 17.1 shows<br />
<strong>the</strong> end-strength <strong>of</strong> <strong>the</strong> Executive Branch<br />
and selected agencies starting in 1940. Table<br />
17.2 shows <strong>the</strong> end-strength <strong>of</strong> <strong>the</strong> Executive