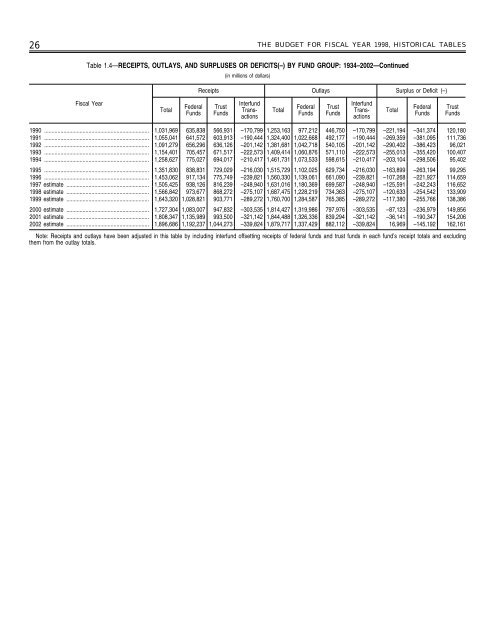
26 THE BUDGET FOR FISCAL YEAR 1998, HISTORICAL TABLES Table 1.4—RECEIPTS, OUTLAYS, AND SURPLUSES OR DEFICITS(–) BY FUND GROUP: 1934–2002—Continued (in millions <strong>of</strong> dollars) Receipts Outlays Surplus or Deficit (–) Fiscal Year Total Federal Funds Trust Funds Interfund Transactions Total Federal Funds Trust Funds Interfund Transactions Total Federal Funds Trust Funds 1990 ....................................................................... 1,031,969 635,838 566,931 –170,799 1,253,163 977,212 446,750 –170,799 –221,194 –341,374 120,180 1991 ....................................................................... 1,055,041 641,572 603,913 –190,444 1,324,400 1,022,668 492,177 –190,444 –269,359 –381,095 111,736 1992 ....................................................................... 1,091,279 656,296 636,126 –201,142 1,381,681 1,042,718 540,105 –201,142 –290,402 –386,423 96,021 1993 ....................................................................... 1,154,401 705,457 671,517 –222,573 1,409,414 1,060,876 571,110 –222,573 –255,013 –355,420 100,407 1994 ....................................................................... 1,258,627 775,027 694,017 –210,417 1,461,731 1,073,533 598,615 –210,417 –203,104 –298,506 95,402 1995 ....................................................................... 1,351,830 838,831 729,029 –216,030 1,515,729 1,102,025 629,734 –216,030 –163,899 –263,194 99,295 1996 ....................................................................... 1,453,062 917,134 775,749 –239,821 1,560,330 1,139,061 661,090 –239,821 –107,268 –221,927 114,659 1997 estimate ........................................................ 1,505,425 938,126 816,239 –248,940 1,631,016 1,180,369 699,587 –248,940 –125,591 –242,243 116,652 1998 estimate ........................................................ 1,566,842 973,677 868,272 –275,107 1,687,475 1,228,219 734,363 –275,107 –120,633 –254,542 133,909 1999 estimate ........................................................ 1,643,320 1,028,821 903,771 –289,272 1,760,700 1,284,587 765,385 –289,272 –117,380 –255,766 138,386 2000 estimate ........................................................ 1,727,304 1,083,007 947,832 –303,535 1,814,427 1,319,986 797,976 –303,535 –87,123 –236,979 149,856 2001 estimate ........................................................ 1,808,347 1,135,989 993,500 –321,142 1,844,488 1,326,336 839,294 –321,142 –36,141 –190,347 154,206 2002 estimate ........................................................ 1,896,686 1,192,237 1,044,273 –339,824 1,879,717 1,337,429 882,112 –339,824 16,969 –145,192 162,161 Note: Receipts and outlays have been adjusted in this table by including interfund <strong>of</strong>fsetting receipts <strong>of</strong> federal funds and trust funds in each fund’s receipt totals and excluding <strong>the</strong>m from <strong>the</strong> outlay totals.
THE BUDGET FOR FISCAL YEAR 1998, HISTORICAL TABLES 27 Fiscal Year Individual Income Taxes Table 2.1—RECEIPTS BY SOURCE: 1934–2002 (in millions <strong>of</strong> dollars) Corporation <strong>Social</strong> Insurance Taxes and Contributions 2 Income Excise Total Receipts Taxes 1 Taxes 2 O<strong>the</strong>r 3 Total (On-<strong>Budget</strong>) (Off-<strong>Budget</strong>) Total (On-<strong>Budget</strong>) (Off-<strong>Budget</strong>) 1934 .................................... 420 364 30 (30) ....................... 1,354 788 2,955 (2,955) ....................... 1935 .................................... 527 529 31 (31) ....................... 1,439 1,084 3,609 (3,609) ....................... 1936 .................................... 674 719 52 (52) ....................... 1,631 847 3,923 (3,923) ....................... 1937 .................................... 1,092 1,038 580 (315) (265) 1,876 801 5,387 (5,122) (265) 1938 .................................... 1,286 1,287 1,541 (1,154) (387) 1,863 773 6,751 (6,364) (387) 1939 .................................... 1,029 1,127 1,593 (1,090) (503) 1,871 675 6,295 (5,792) (503) 1940 .................................... 892 1,197 1,785 (1,235) (550) 1,977 698 6,548 (5,998) (550) 1941 .................................... 1,314 2,124 1,940 (1,252) (688) 2,552 781 8,712 (8,024) (688) 1942 .................................... 3,263 4,719 2,452 (1,557) (896) 3,399 801 14,634 (13,738) (896) 1943 .................................... 6,505 9,557 3,044 (1,913) (1,130) 4,096 800 24,001 (22,871) (1,130) 1944 .................................... 19,705 14,838 3,473 (2,181) (1,292) 4,759 972 43,747 (42,455) (1,292) 1945 .................................... 18,372 15,988 3,451 (2,141) (1,310) 6,265 1,083 45,159 (43,849) (1,310) 1946 .................................... 16,098 11,883 3,115 (1,877) (1,238) 6,998 1,202 39,296 (38,057) (1,238) 1947 .................................... 17,935 8,615 3,422 (1,963) (1,459) 7,211 1,331 38,514 (37,055) (1,459) 1948 .................................... 19,315 9,678 3,751 (2,134) (1,616) 7,356 1,461 41,560 (39,944) (1,616) 1949 .................................... 15,552 11,192 3,781 (2,091) (1,690) 7,502 1,388 39,415 (37,724) (1,690) 1950 .................................... 15,755 10,449 4,338 (2,232) (2,106) 7,550 1,351 39,443 (37,336) (2,106) 1951 .................................... 21,616 14,101 5,674 (2,554) (3,120) 8,648 1,578 51,616 (48,496) (3,120) 1952 .................................... 27,934 21,226 6,445 (2,851) (3,594) 8,852 1,710 66,167 (62,573) (3,594) 1953 .................................... 29,816 21,238 6,820 (2,723) (4,097) 9,877 1,857 69,608 (65,511) (4,097) 1954 .................................... 29,542 21,101 7,208 (2,619) (4,589) 9,945 1,905 69,701 (65,112) (4,589) 1955 .................................... 28,747 17,861 7,862 (2,781) (5,081) 9,131 1,850 65,451 (60,370) (5,081) 1956 .................................... 32,188 20,880 9,320 (2,896) (6,425) 9,929 2,270 74,587 (68,162) (6,425) 1957 .................................... 35,620 21,167 9,997 (3,208) (6,789) 10,534 2,672 79,990 (73,201) (6,789) 1958 .................................... 34,724 20,074 11,239 (3,190) (8,049) 10,638 2,961 79,636 (71,587) (8,049) 1959 .................................... 36,719 17,309 11,722 (3,427) (8,296) 10,578 2,921 79,249 (70,953) (8,296) 1960 .................................... 40,715 21,494 14,683 (4,042) (10,641) 11,676 3,923 92,492 (81,851) (10,641) 1961 .................................... 41,338 20,954 16,439 (4,331) (12,109) 11,860 3,796 94,388 (82,279) (12,109) 1962 .................................... 45,571 20,523 17,046 (4,776) (12,271) 12,534 4,001 99,676 (87,405) (12,271) 1963 .................................... 47,588 21,579 19,804 (5,629) (14,175) 13,194 4,395 106,560 (92,385) (14,175) 1964 .................................... 48,697 23,493 21,963 (5,597) (16,366) 13,731 4,731 112,613 (96,248) (16,366) 1965 .................................... 48,792 25,461 22,242 (5,519) (16,723) 14,570 5,753 116,817 (100,094) (16,723) 1966 .................................... 55,446 30,073 25,546 (6,460) (19,085) 13,062 6,708 130,835 (111,749) (19,085) 1967 .................................... 61,526 33,971 32,619 (8,217) (24,401) 13,719 6,987 148,822 (124,420) (24,401) 1968 .................................... 68,726 28,665 33,923 (9,007) (24,917) 14,079 7,580 152,973 (128,056) (24,917) 1969 .................................... 87,249 36,678 39,015 (10,062) (28,953) 15,222 8,718 186,882 (157,928) (28,953) 1970 .................................... 90,412 32,829 44,362 (10,903) (33,459) 15,705 9,499 192,807 (159,348) (33,459) 1971 .................................... 86,230 26,785 47,325 (11,481) (35,845) 16,614 10,185 187,139 (151,294) (35,845) 1972 .................................... 94,737 32,166 52,574 (12,667) (39,907) 15,477 12,355 207,309 (167,402) (39,907) 1973 .................................... 103,246 36,153 63,115 (17,031) (46,084) 16,260 12,026 230,799 (184,715) (46,084) 1974 .................................... 118,952 38,620 75,071 (21,146) (53,925) 16,844 13,737 263,224 (209,299) (53,925) 1975 .................................... 122,386 40,621 84,534 (22,077) (62,458) 16,551 14,998 279,090 (216,633) (62,458) 1976 .................................... 131,603 41,409 90,769 (24,381) (66,389) 16,963 17,317 298,060 (231,671) (66,389) TQ ....................................... 38,801 8,460 25,219 (7,203) (18,016) 4,473 4,279 81,232 (63,216) (18,016) 1977 .................................... 157,626 54,892 106,485 (29,668) (76,817) 17,548 19,008 355,559 (278,741) (76,817) 1978 .................................... 180,988 59,952 120,967 (35,576) (85,391) 18,376 19,278 399,561 (314,169) (85,391) 1979 .................................... 217,841 65,677 138,939 (40,945) (97,994) 18,745 22,101 463,302 (365,309) (97,994) 1980 .................................... 244,069 64,600 157,803 (44,594) (113,209) 24,329 26,311 517,112 (403,903) (113,209) 1981 .................................... 285,917 61,137 182,720 (52,545) (130,176) 40,839 28,659 599,272 (469,097) (130,176) 1982 .................................... 297,744 49,207 201,498 (58,031) (143,467) 36,311 33,006 617,766 (474,299) (143,467) 1983 .................................... 288,938 37,022 208,994 (61,674) (147,320) 35,300 30,309 600,562 (453,242) (147,320) 1984 .................................... 298,415 56,893 239,376 (73,301) (166,075) 37,361 34,454 666,499 (500,424) (166,075) 1985 .................................... 334,531 61,331 265,163 (78,992) (186,171) 35,992 37,148 734,165 (547,994) (186,171) 1986 .................................... 348,959 63,143 283,901 (83,673) (200,228) 32,919 40,337 769,260 (569,031) (200,228) 1987 .................................... 392,557 83,926 303,318 (89,916) (213,402) 32,457 42,137 854,396 (640,994) (213,402) 1988 .................................... 401,181 94,508 334,335 (92,845) (241,491) 35,227 44,051 909,303 (667,812) (241,491) 1989 .................................... 445,690 103,291 359,416 (95,751) (263,666) 34,386 48,407 991,190 (727,525) (263,666) See footnotes at end <strong>of</strong> table.
- Page 1 and 2: HISTORICAL TABLES BUDGET OF THE UNI
- Page 3 and 4: Contents of the Historical Tables P
- Page 5 and 6: INTRODUCTION STRUCTURE, COVERAGE AN
- Page 7 and 8: THE BUDGET FOR FISCAL YEAR 1998, HI
- Page 9 and 10: SECTION NOTES Notes on Section 1 (O
- Page 11 and 12: THE BUDGET FOR FISCAL YEAR 1998, HI
- Page 13 and 14: THE BUDGET FOR FISCAL YEAR 1998, HI
- Page 15 and 16: THE BUDGET FOR FISCAL YEAR 1998, HI
- Page 17: THE BUDGET FOR FISCAL YEAR 1998, HI
- Page 20 and 21: 16 THE BUDGET FOR FISCAL YEAR 1998,
- Page 22: 18 THE BUDGET FOR FISCAL YEAR 1998,
- Page 25 and 26: THE BUDGET FOR FISCAL YEAR 1998, HI
- Page 27 and 28: THE BUDGET FOR FISCAL YEAR 1998, HI
- Page 29 and 30: THE BUDGET FOR FISCAL YEAR 1998, HI
- Page 31: THE BUDGET FOR FISCAL YEAR 1998, HI
- Page 35 and 36: THE BUDGET FOR FISCAL YEAR 1998, HI
- Page 37 and 38: THE BUDGET FOR FISCAL YEAR 1998, HI
- Page 39 and 40: THE BUDGET FOR FISCAL YEAR 1998, HI
- Page 41 and 42: THE BUDGET FOR FISCAL YEAR 1998, HI
- Page 43 and 44: THE BUDGET FOR FISCAL YEAR 1998, HI
- Page 45 and 46: THE BUDGET FOR FISCAL YEAR 1998, HI
- Page 47 and 48: THE BUDGET FOR FISCAL YEAR 1998, HI
- Page 49 and 50: THE BUDGET FOR FISCAL YEAR 1998, HI
- Page 51 and 52: THE BUDGET FOR FISCAL YEAR 1998, HI
- Page 53 and 54: THE BUDGET FOR FISCAL YEAR 1998, HI
- Page 55 and 56: THE BUDGET FOR FISCAL YEAR 1998, HI
- Page 57 and 58: THE BUDGET FOR FISCAL YEAR 1998, HI
- Page 59 and 60: THE BUDGET FOR FISCAL YEAR 1998, HI
- Page 61 and 62: THE BUDGET FOR FISCAL YEAR 1998, HI
- Page 63 and 64: THE BUDGET FOR FISCAL YEAR 1998, HI
- Page 65 and 66: THE BUDGET FOR FISCAL YEAR 1998, HI
- Page 67 and 68: THE BUDGET FOR FISCAL YEAR 1998, HI
- Page 69 and 70: THE BUDGET FOR FISCAL YEAR 1998, HI
- Page 71 and 72: THE BUDGET FOR FISCAL YEAR 1998, HI
- Page 73 and 74: THE BUDGET FOR FISCAL YEAR 1998, HI
- Page 75 and 76: THE BUDGET FOR FISCAL YEAR 1998, HI
- Page 77 and 78: THE BUDGET FOR FISCAL YEAR 1998, HI
- Page 79 and 80: THE BUDGET FOR FISCAL YEAR 1998, HI
- Page 81 and 82: THE BUDGET FOR FISCAL YEAR 1998, HI
- Page 83 and 84:
THE BUDGET FOR FISCAL YEAR 1998, HI
- Page 85 and 86:
THE BUDGET FOR FISCAL YEAR 1998, HI
- Page 87 and 88:
THE BUDGET FOR FISCAL YEAR 1998, HI
- Page 89 and 90:
THE BUDGET FOR FISCAL YEAR 1998, HI
- Page 91 and 92:
THE BUDGET FOR FISCAL YEAR 1998, HI
- Page 93 and 94:
THE BUDGET FOR FISCAL YEAR 1998, HI
- Page 95 and 96:
THE BUDGET FOR FISCAL YEAR 1998, HI
- Page 97 and 98:
THE BUDGET FOR FISCAL YEAR 1998, HI
- Page 99 and 100:
THE BUDGET FOR FISCAL YEAR 1998, HI
- Page 101 and 102:
THE BUDGET FOR FISCAL YEAR 1998, HI
- Page 103 and 104:
THE BUDGET FOR FISCAL YEAR 1998, HI
- Page 105 and 106:
THE BUDGET FOR FISCAL YEAR 1998, HI
- Page 107 and 108:
THE BUDGET FOR FISCAL YEAR 1998, HI
- Page 109 and 110:
THE BUDGET FOR FISCAL YEAR 1998, HI
- Page 111 and 112:
THE BUDGET FOR FISCAL YEAR 1998, HI
- Page 113 and 114:
THE BUDGET FOR FISCAL YEAR 1998, HI
- Page 115 and 116:
THE BUDGET FOR FISCAL YEAR 1998, HI
- Page 117 and 118:
THE BUDGET FOR FISCAL YEAR 1998, HI
- Page 119 and 120:
THE BUDGET FOR FISCAL YEAR 1998, HI
- Page 121 and 122:
THE BUDGET FOR FISCAL YEAR 1998, HI
- Page 123 and 124:
THE BUDGET FOR FISCAL YEAR 1998, HI
- Page 125 and 126:
THE BUDGET FOR FISCAL YEAR 1998, HI
- Page 127 and 128:
THE BUDGET FOR FISCAL YEAR 1998, HI
- Page 129 and 130:
THE BUDGET FOR FISCAL YEAR 1998, HI
- Page 131 and 132:
THE BUDGET FOR FISCAL YEAR 1998, HI
- Page 133 and 134:
THE BUDGET FOR FISCAL YEAR 1998, HI
- Page 135 and 136:
THE BUDGET FOR FISCAL YEAR 1998, HI
- Page 137 and 138:
THE BUDGET FOR FISCAL YEAR 1998, HI
- Page 139 and 140:
THE BUDGET FOR FISCAL YEAR 1998, HI
- Page 141 and 142:
THE BUDGET FOR FISCAL YEAR 1998, HI
- Page 143 and 144:
THE BUDGET FOR FISCAL YEAR 1998, HI
- Page 145 and 146:
THE BUDGET FOR FISCAL YEAR 1998, HI
- Page 147 and 148:
THE BUDGET FOR FISCAL YEAR 1998, HI
- Page 149 and 150:
THE BUDGET FOR FISCAL YEAR 1998, HI
- Page 151 and 152:
THE BUDGET FOR FISCAL YEAR 1998, HI
- Page 153 and 154:
THE BUDGET FOR FISCAL YEAR 1998, HI
- Page 155 and 156:
THE BUDGET FOR FISCAL YEAR 1998, HI
- Page 157 and 158:
THE BUDGET FOR FISCAL YEAR 1998, HI
- Page 159 and 160:
THE BUDGET FOR FISCAL YEAR 1998, HI
- Page 161 and 162:
THE BUDGET FOR FISCAL YEAR 1998, HI
- Page 163 and 164:
THE BUDGET FOR FISCAL YEAR 1998, HI
- Page 165 and 166:
THE BUDGET FOR FISCAL YEAR 1998, HI
- Page 167 and 168:
THE BUDGET FOR FISCAL YEAR 1998, HI
- Page 169 and 170:
THE BUDGET FOR FISCAL YEAR 1998, HI
- Page 171 and 172:
THE BUDGET FOR FISCAL YEAR 1998, HI
- Page 173 and 174:
THE BUDGET FOR FISCAL YEAR 1998, HI
- Page 175 and 176:
THE BUDGET FOR FISCAL YEAR 1998, HI
- Page 177 and 178:
THE BUDGET FOR FISCAL YEAR 1998, HI
- Page 179 and 180:
THE BUDGET FOR FISCAL YEAR 1998, HI
- Page 181 and 182:
THE BUDGET FOR FISCAL YEAR 1998, HI
- Page 183 and 184:
THE BUDGET FOR FISCAL YEAR 1998, HI
- Page 185 and 186:
THE BUDGET FOR FISCAL YEAR 1998, HI
- Page 187 and 188:
THE BUDGET FOR FISCAL YEAR 1998, HI
- Page 189 and 190:
THE BUDGET FOR FISCAL YEAR 1998, HI
- Page 191 and 192:
THE BUDGET FOR FISCAL YEAR 1998, HI
- Page 193 and 194:
THE BUDGET FOR FISCAL YEAR 1998, HI
- Page 195 and 196:
THE BUDGET FOR FISCAL YEAR 1998, HI
- Page 197 and 198:
THE BUDGET FOR FISCAL YEAR 1998, HI
- Page 199 and 200:
THE BUDGET FOR FISCAL YEAR 1998, HI
- Page 201 and 202:
THE BUDGET FOR FISCAL YEAR 1998, HI
- Page 203 and 204:
THE BUDGET FOR FISCAL YEAR 1998, HI
- Page 205 and 206:
THE BUDGET FOR FISCAL YEAR 1998, HI
- Page 207 and 208:
THE BUDGET FOR FISCAL YEAR 1998, HI
- Page 209 and 210:
THE BUDGET FOR FISCAL YEAR 1998, HI
- Page 211 and 212:
THE BUDGET FOR FISCAL YEAR 1998, HI
- Page 213 and 214:
THE BUDGET FOR FISCAL YEAR 1998, HI
- Page 215 and 216:
THE BUDGET FOR FISCAL YEAR 1998, HI
- Page 217 and 218:
THE BUDGET FOR FISCAL YEAR 1998, HI
- Page 219 and 220:
THE BUDGET FOR FISCAL YEAR 1998, HI
- Page 221 and 222:
THE BUDGET FOR FISCAL YEAR 1998, HI
- Page 223 and 224:
THE BUDGET FOR FISCAL YEAR 1998, HI
- Page 225 and 226:
THE BUDGET FOR FISCAL YEAR 1998, HI
- Page 227 and 228:
THE BUDGET FOR FISCAL YEAR 1998, HI
- Page 229 and 230:
THE BUDGET FOR FISCAL YEAR 1998, HI
- Page 231 and 232:
THE BUDGET FOR FISCAL YEAR 1998, HI
- Page 233 and 234:
THE BUDGET FOR FISCAL YEAR 1998, HI
- Page 235 and 236:
THE BUDGET FOR FISCAL YEAR 1998, HI
- Page 237 and 238:
THE BUDGET FOR FISCAL YEAR 1998, HI
- Page 239 and 240:
THE BUDGET FOR FISCAL YEAR 1998, HI
- Page 241 and 242:
THE BUDGET FOR FISCAL YEAR 1998, HI
- Page 243 and 244:
THE BUDGET FOR FISCAL YEAR 1998, HI
- Page 245 and 246:
THE BUDGET FOR FISCAL YEAR 1998, HI
- Page 247 and 248:
THE BUDGET FOR FISCAL YEAR 1998, HI
- Page 249 and 250:
THE BUDGET FOR FISCAL YEAR 1998, HI
- Page 251 and 252:
THE BUDGET FOR FISCAL YEAR 1998, HI
- Page 253 and 254:
THE BUDGET FOR FISCAL YEAR 1998, HI
- Page 255 and 256:
THE BUDGET FOR FISCAL YEAR 1998, HI
- Page 257 and 258:
THE BUDGET FOR FISCAL YEAR 1998, HI
- Page 259 and 260:
THE BUDGET FOR FISCAL YEAR 1998, HI
- Page 261 and 262:
THE BUDGET FOR FISCAL YEAR 1998, HI
- Page 263 and 264:
THE BUDGET FOR FISCAL YEAR 1998, HI
- Page 265 and 266:
THE BUDGET FOR FISCAL YEAR 1998, HI
- Page 267 and 268:
THE BUDGET FOR FISCAL YEAR 1998, HI
- Page 269 and 270:
THE BUDGET FOR FISCAL YEAR 1998, HI
- Page 271 and 272:
THE BUDGET FOR FISCAL YEAR 1998, HI
- Page 273 and 274:
THE BUDGET FOR FISCAL YEAR 1998, HI
- Page 275 and 276:
THE BUDGET FOR FISCAL YEAR 1998, HI
- Page 277:
THE BUDGET FOR FISCAL YEAR 1998, HI