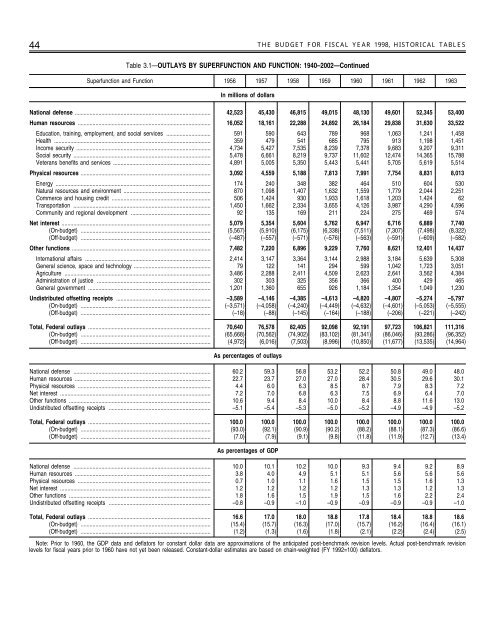
44 THE BUDGET FOR FISCAL YEAR 1998, HISTORICAL TABLES Table 3.1—OUTLAYS BY SUPERFUNCTION AND FUNCTION: 1940–2002—Continued Superfunction and Function 1956 1957 1958 1959 1960 1961 1962 1963 In millions <strong>of</strong> dollars National defense ............................................................................................ 42,523 45,430 46,815 49,015 48,130 49,601 52,345 53,400 Human resources .......................................................................................... 16,052 18,161 22,288 24,892 26,184 29,838 31,630 33,522 Education, training, employment, and social services .............................. 591 590 643 789 968 1,063 1,241 1,458 Health .......................................................................................................... 359 479 541 685 795 913 1,198 1,451 Income security ........................................................................................... 4,734 5,427 7,535 8,239 7,378 9,683 9,207 9,311 <strong>Social</strong> security ............................................................................................. 5,478 6,661 8,219 9,737 11,602 12,474 14,365 15,788 Veterans benefits and services .................................................................. 4,891 5,005 5,350 5,443 5,441 5,705 5,619 5,514 Physical resources ........................................................................................ 3,092 4,559 5,188 7,813 7,991 7,754 8,831 8,013 Energy ......................................................................................................... 174 240 348 382 464 510 604 530 Natural resources and environment ........................................................... 870 1,098 1,407 1,632 1,559 1,779 2,044 2,251 Commerce and housing credit ................................................................... 506 1,424 930 1,933 1,618 1,203 1,424 62 Transportation ............................................................................................. 1,450 1,662 2,334 3,655 4,126 3,987 4,290 4,596 Community and regional development ...................................................... 92 135 169 211 224 275 469 574 Net interest ..................................................................................................... 5,079 5,354 5,604 5,762 6,947 6,716 6,889 7,740 (On-budget) ........................................................................................ (5,567) (5,910) (6,175) (6,338) (7,511) (7,307) (7,498) (8,322) (Off-budget) ........................................................................................ (–487) (–557) (–571) (–576) (–563) (–591) (–609) (–582) O<strong>the</strong>r functions .............................................................................................. 7,482 7,220 6,896 9,229 7,760 8,621 12,401 14,437 International affairs ..................................................................................... 2,414 3,147 3,364 3,144 2,988 3,184 5,639 5,308 General science, space and technology .................................................... 79 122 141 294 599 1,042 1,723 3,051 Agriculture ................................................................................................... 3,486 2,288 2,411 4,509 2,623 2,641 3,562 4,384 Administration <strong>of</strong> justice ............................................................................. 302 303 325 356 366 400 429 465 General government ................................................................................... 1,201 1,360 655 926 1,184 1,354 1,049 1,230 Undistributed <strong>of</strong>fsetting receipts ................................................................ –3,589 –4,146 –4,385 –4,613 –4,820 –4,807 –5,274 –5,797 (On-budget) ........................................................................................ (–3,571) (–4,058) (–4,240) (–4,449) (–4,632) (–4,601) (–5,053) (–5,555) (Off-budget) ........................................................................................ (–18) (–88) (–145) (–164) (–188) (–206) (–221) (–242) Total, Federal outlays ................................................................................... 70,640 76,578 82,405 92,098 92,191 97,723 106,821 111,316 (On-budget) ........................................................................................ (65,668) (70,562) (74,902) (83,102) (81,341) (86,046) (93,286) (96,352) (Off-budget) ........................................................................................ (4,972) (6,016) (7,503) (8,996) (10,850) (11,677) (13,535) (14,964) As percentages <strong>of</strong> outlays National defense ............................................................................................. 60.2 59.3 56.8 53.2 52.2 50.8 49.0 48.0 Human resources ............................................................................................ 22.7 23.7 27.0 27.0 28.4 30.5 29.6 30.1 Physical resources .......................................................................................... 4.4 6.0 6.3 8.5 8.7 7.9 8.3 7.2 Net interest ...................................................................................................... 7.2 7.0 6.8 6.3 7.5 6.9 6.4 7.0 O<strong>the</strong>r functions ................................................................................................ 10.6 9.4 8.4 10.0 8.4 8.8 11.6 13.0 Undistributed <strong>of</strong>fsetting receipts ..................................................................... –5.1 –5.4 –5.3 –5.0 –5.2 –4.9 –4.9 –5.2 Total, Federal outlays ................................................................................... 100.0 100.0 100.0 100.0 100.0 100.0 100.0 100.0 (On-budget) ........................................................................................ (93.0) (92.1) (90.9) (90.2) (88.2) (88.1) (87.3) (86.6) (Off-budget) ........................................................................................ (7.0) (7.9) (9.1) (9.8) (11.8) (11.9) (12.7) (13.4) As percentages <strong>of</strong> GDP National defense ............................................................................................. 10.0 10.1 10.2 10.0 9.3 9.4 9.2 8.9 Human resources ............................................................................................ 3.8 4.0 4.9 5.1 5.1 5.6 5.6 5.6 Physical resources .......................................................................................... 0.7 1.0 1.1 1.6 1.5 1.5 1.6 1.3 Net interest ...................................................................................................... 1.2 1.2 1.2 1.2 1.3 1.3 1.2 1.3 O<strong>the</strong>r functions ................................................................................................ 1.8 1.6 1.5 1.9 1.5 1.6 2.2 2.4 Undistributed <strong>of</strong>fsetting receipts ..................................................................... –0.8 –0.9 –1.0 –0.9 –0.9 –0.9 –0.9 –1.0 Total, Federal outlays ................................................................................... 16.6 17.0 18.0 18.8 17.8 18.4 18.8 18.6 (On-budget) ........................................................................................ (15.4) (15.7) (16.3) (17.0) (15.7) (16.2) (16.4) (16.1) (Off-budget) ........................................................................................ (1.2) (1.3) (1.6) (1.8) (2.1) (2.2) (2.4) (2.5) Note: Prior to 1960, <strong>the</strong> GDP data and deflators for constant dollar data are approximations <strong>of</strong> <strong>the</strong> anticipated post-benchmark revision levels. Actual post-benchmark revision levels for fiscal years prior to 1960 have not yet been released. Constant-dollar estimates are based on chain-weighted (FY 1992=100) deflators.
THE BUDGET FOR FISCAL YEAR 1998, HISTORICAL TABLES 45 Table 3.1—OUTLAYS BY SUPERFUNCTION AND FUNCTION: 1940–2002—Continued Superfunction and Function 1964 1965 1966 1967 1968 1969 1970 1971 In millions <strong>of</strong> dollars National defense ............................................................................................ 54,757 50,620 58,111 71,417 81,926 82,497 81,692 78,872 Human resources .......................................................................................... 35,294 36,576 43,257 51,272 59,375 66,410 75,349 91,901 Education, training, employment, and social services .............................. 1,555 2,140 4,363 6,453 7,634 7,548 8,634 9,849 Health .......................................................................................................... 1,788 1,791 2,543 3,351 4,390 5,162 5,907 6,843 Medicare ...................................................................................................... .................... .................... 64 2,748 4,649 5,695 6,213 6,622 Income security ........................................................................................... 9,657 9,469 9,678 10,261 11,816 13,076 15,655 22,946 <strong>Social</strong> security ............................................................................................. 16,620 17,460 20,694 21,725 23,854 27,298 30,270 35,872 (On-budget) ........................................................................................ .................... .................... .................... (94) (94) (414) (458) (465) (Off-budget) ........................................................................................ (16,620) (17,460) (20,694) (21,631) (23,760) (26,885) (29,812) (35,408) Veterans benefits and services .................................................................. 5,675 5,716 5,916 6,735 7,032 7,631 8,669 9,768 Physical resources ........................................................................................ 9,528 11,264 13,410 14,674 16,002 11,869 15,574 18,286 Energy ......................................................................................................... 572 699 612 782 1,037 1,010 997 1,035 Natural resources and environment ........................................................... 2,364 2,531 2,719 2,869 2,988 2,900 3,065 3,915 Commerce and housing credit ................................................................... 418 1,157 3,245 3,979 4,280 –119 2,112 2,366 Transportation ............................................................................................. 5,242 5,763 5,730 5,936 6,316 6,526 7,008 8,052 Community and regional development ...................................................... 933 1,114 1,105 1,108 1,382 1,552 2,392 2,917 Net interest ..................................................................................................... 8,199 8,591 9,386 10,268 11,090 12,699 14,380 14,841 (On-budget) ........................................................................................ (8,805) (9,239) (10,028) (11,060) (12,069) (13,848) (15,948) (16,783) (Off-budget) ........................................................................................ (–607) (–648) (–642) (–792) (–979) (–1,149) (–1,568) (–1,942) O<strong>the</strong>r functions .............................................................................................. 16,458 17,086 16,911 17,126 17,786 18,151 17,286 16,379 International affairs ..................................................................................... 4,945 5,273 5,580 5,566 5,301 4,600 4,330 4,159 General science, space and technology .................................................... 4,897 5,823 6,717 6,233 5,524 5,020 4,511 4,182 Agriculture ................................................................................................... 4,609 3,955 2,447 2,990 4,545 5,826 5,166 4,290 Administration <strong>of</strong> justice ............................................................................. 489 535 563 618 659 766 959 1,306 General government ................................................................................... 1,518 1,499 1,603 1,719 1,757 1,939 2,320 2,442 Undistributed <strong>of</strong>fsetting receipts ................................................................ –5,708 –5,908 –6,542 –7,294 –8,045 –7,986 –8,632 –10,107 (On-budget) ........................................................................................ (–5,429) (–5,626) (–6,205) (–6,879) (–7,600) (–7,454) (–7,995) (–9,467) (Off-budget) ........................................................................................ (–279) (–282) (–337) (–415) (–445) (–532) (–637) (–640) Total, Federal outlays ................................................................................... 118,528 118,228 134,532 157,464 178,134 183,640 195,649 210,172 (On-budget) ........................................................................................ (102,794) (101,699) (114,817) (137,040) (155,798) (158,436) (168,042) (177,346) (Off-budget) ........................................................................................ (15,734) (16,529) (19,715) (20,424) (22,336) (25,204) (27,607) (32,826) As percentages <strong>of</strong> outlays National defense ............................................................................................. 46.2 42.8 43.2 45.4 46.0 44.9 41.8 37.5 Human resources ............................................................................................ 29.8 30.9 32.2 32.6 33.3 36.2 38.5 43.7 Physical resources .......................................................................................... 8.0 9.5 10.0 9.3 9.0 6.5 8.0 8.7 Net interest ...................................................................................................... 6.9 7.3 7.0 6.5 6.2 6.9 7.4 7.1 O<strong>the</strong>r functions ................................................................................................ 13.9 14.5 12.6 10.9 10.0 9.9 8.8 7.8 Undistributed <strong>of</strong>fsetting receipts ..................................................................... –4.8 –5.0 –4.9 –4.6 –4.5 –4.3 –4.4 –4.8 Total, Federal outlays ................................................................................... 100.0 100.0 100.0 100.0 100.0 100.0 100.0 100.0 (On-budget) ........................................................................................ (86.7) (86.0) (85.3) (87.0) (87.5) (86.3) (85.9) (84.4) (Off-budget) ........................................................................................ (13.3) (14.0) (14.7) (13.0) (12.5) (13.7) (14.1) (15.6) As percentages <strong>of</strong> GDP National defense ............................................................................................. 8.6 7.4 7.7 8.8 9.4 8.7 8.1 7.3 Human resources ............................................................................................ 5.5 5.3 5.7 6.3 6.8 7.0 7.5 8.5 Physical resources .......................................................................................... 1.5 1.6 1.8 1.8 1.8 1.3 1.5 1.7 Net interest ...................................................................................................... 1.3 1.3 1.2 1.3 1.3 1.3 1.4 1.4 O<strong>the</strong>r functions ................................................................................................ 2.6 2.5 2.2 2.1 2.0 1.9 1.7 1.5 Undistributed <strong>of</strong>fsetting receipts ..................................................................... –0.9 –0.9 –0.9 –0.9 –0.9 –0.8 –0.9 –0.9 Total, Federal outlays ................................................................................... 18.5 17.2 17.9 19.4 20.5 19.4 19.4 19.5 (On-budget) ........................................................................................ (16.1) (14.8) (15.3) (16.9) (17.9) (16.7) (16.6) (16.5) (Off-budget) ........................................................................................ (2.5) (2.4) (2.6) (2.5) (2.6) (2.7) (2.7) (3.0) Note: Prior to 1960, <strong>the</strong> GDP data and deflators for constant dollar data are approximations <strong>of</strong> <strong>the</strong> anticipated post-benchmark revision levels. Actual post-benchmark revision levels for fiscal years prior to 1960 have not yet been released. Constant-dollar estimates are based on chain-weighted (FY 1992=100) deflators.
- Page 1 and 2: HISTORICAL TABLES BUDGET OF THE UNI
- Page 3 and 4: Contents of the Historical Tables P
- Page 5 and 6: INTRODUCTION STRUCTURE, COVERAGE AN
- Page 7 and 8: THE BUDGET FOR FISCAL YEAR 1998, HI
- Page 9 and 10: SECTION NOTES Notes on Section 1 (O
- Page 11 and 12: THE BUDGET FOR FISCAL YEAR 1998, HI
- Page 13 and 14: THE BUDGET FOR FISCAL YEAR 1998, HI
- Page 15 and 16: THE BUDGET FOR FISCAL YEAR 1998, HI
- Page 17: THE BUDGET FOR FISCAL YEAR 1998, HI
- Page 20 and 21: 16 THE BUDGET FOR FISCAL YEAR 1998,
- Page 22: 18 THE BUDGET FOR FISCAL YEAR 1998,
- Page 25 and 26: THE BUDGET FOR FISCAL YEAR 1998, HI
- Page 27 and 28: THE BUDGET FOR FISCAL YEAR 1998, HI
- Page 29 and 30: THE BUDGET FOR FISCAL YEAR 1998, HI
- Page 31 and 32: THE BUDGET FOR FISCAL YEAR 1998, HI
- Page 33 and 34: THE BUDGET FOR FISCAL YEAR 1998, HI
- Page 35 and 36: THE BUDGET FOR FISCAL YEAR 1998, HI
- Page 37 and 38: THE BUDGET FOR FISCAL YEAR 1998, HI
- Page 39 and 40: THE BUDGET FOR FISCAL YEAR 1998, HI
- Page 41 and 42: THE BUDGET FOR FISCAL YEAR 1998, HI
- Page 43 and 44: THE BUDGET FOR FISCAL YEAR 1998, HI
- Page 45 and 46: THE BUDGET FOR FISCAL YEAR 1998, HI
- Page 47 and 48: THE BUDGET FOR FISCAL YEAR 1998, HI
- Page 49: THE BUDGET FOR FISCAL YEAR 1998, HI
- Page 53 and 54: THE BUDGET FOR FISCAL YEAR 1998, HI
- Page 55 and 56: THE BUDGET FOR FISCAL YEAR 1998, HI
- Page 57 and 58: THE BUDGET FOR FISCAL YEAR 1998, HI
- Page 59 and 60: THE BUDGET FOR FISCAL YEAR 1998, HI
- Page 61 and 62: THE BUDGET FOR FISCAL YEAR 1998, HI
- Page 63 and 64: THE BUDGET FOR FISCAL YEAR 1998, HI
- Page 65 and 66: THE BUDGET FOR FISCAL YEAR 1998, HI
- Page 67 and 68: THE BUDGET FOR FISCAL YEAR 1998, HI
- Page 69 and 70: THE BUDGET FOR FISCAL YEAR 1998, HI
- Page 71 and 72: THE BUDGET FOR FISCAL YEAR 1998, HI
- Page 73 and 74: THE BUDGET FOR FISCAL YEAR 1998, HI
- Page 75 and 76: THE BUDGET FOR FISCAL YEAR 1998, HI
- Page 77 and 78: THE BUDGET FOR FISCAL YEAR 1998, HI
- Page 79 and 80: THE BUDGET FOR FISCAL YEAR 1998, HI
- Page 81 and 82: THE BUDGET FOR FISCAL YEAR 1998, HI
- Page 83 and 84: THE BUDGET FOR FISCAL YEAR 1998, HI
- Page 85 and 86: THE BUDGET FOR FISCAL YEAR 1998, HI
- Page 87 and 88: THE BUDGET FOR FISCAL YEAR 1998, HI
- Page 89 and 90: THE BUDGET FOR FISCAL YEAR 1998, HI
- Page 91 and 92: THE BUDGET FOR FISCAL YEAR 1998, HI
- Page 93 and 94: THE BUDGET FOR FISCAL YEAR 1998, HI
- Page 95 and 96: THE BUDGET FOR FISCAL YEAR 1998, HI
- Page 97 and 98: THE BUDGET FOR FISCAL YEAR 1998, HI
- Page 99 and 100: THE BUDGET FOR FISCAL YEAR 1998, HI
- Page 101 and 102:
THE BUDGET FOR FISCAL YEAR 1998, HI
- Page 103 and 104:
THE BUDGET FOR FISCAL YEAR 1998, HI
- Page 105 and 106:
THE BUDGET FOR FISCAL YEAR 1998, HI
- Page 107 and 108:
THE BUDGET FOR FISCAL YEAR 1998, HI
- Page 109 and 110:
THE BUDGET FOR FISCAL YEAR 1998, HI
- Page 111 and 112:
THE BUDGET FOR FISCAL YEAR 1998, HI
- Page 113 and 114:
THE BUDGET FOR FISCAL YEAR 1998, HI
- Page 115 and 116:
THE BUDGET FOR FISCAL YEAR 1998, HI
- Page 117 and 118:
THE BUDGET FOR FISCAL YEAR 1998, HI
- Page 119 and 120:
THE BUDGET FOR FISCAL YEAR 1998, HI
- Page 121 and 122:
THE BUDGET FOR FISCAL YEAR 1998, HI
- Page 123 and 124:
THE BUDGET FOR FISCAL YEAR 1998, HI
- Page 125 and 126:
THE BUDGET FOR FISCAL YEAR 1998, HI
- Page 127 and 128:
THE BUDGET FOR FISCAL YEAR 1998, HI
- Page 129 and 130:
THE BUDGET FOR FISCAL YEAR 1998, HI
- Page 131 and 132:
THE BUDGET FOR FISCAL YEAR 1998, HI
- Page 133 and 134:
THE BUDGET FOR FISCAL YEAR 1998, HI
- Page 135 and 136:
THE BUDGET FOR FISCAL YEAR 1998, HI
- Page 137 and 138:
THE BUDGET FOR FISCAL YEAR 1998, HI
- Page 139 and 140:
THE BUDGET FOR FISCAL YEAR 1998, HI
- Page 141 and 142:
THE BUDGET FOR FISCAL YEAR 1998, HI
- Page 143 and 144:
THE BUDGET FOR FISCAL YEAR 1998, HI
- Page 145 and 146:
THE BUDGET FOR FISCAL YEAR 1998, HI
- Page 147 and 148:
THE BUDGET FOR FISCAL YEAR 1998, HI
- Page 149 and 150:
THE BUDGET FOR FISCAL YEAR 1998, HI
- Page 151 and 152:
THE BUDGET FOR FISCAL YEAR 1998, HI
- Page 153 and 154:
THE BUDGET FOR FISCAL YEAR 1998, HI
- Page 155 and 156:
THE BUDGET FOR FISCAL YEAR 1998, HI
- Page 157 and 158:
THE BUDGET FOR FISCAL YEAR 1998, HI
- Page 159 and 160:
THE BUDGET FOR FISCAL YEAR 1998, HI
- Page 161 and 162:
THE BUDGET FOR FISCAL YEAR 1998, HI
- Page 163 and 164:
THE BUDGET FOR FISCAL YEAR 1998, HI
- Page 165 and 166:
THE BUDGET FOR FISCAL YEAR 1998, HI
- Page 167 and 168:
THE BUDGET FOR FISCAL YEAR 1998, HI
- Page 169 and 170:
THE BUDGET FOR FISCAL YEAR 1998, HI
- Page 171 and 172:
THE BUDGET FOR FISCAL YEAR 1998, HI
- Page 173 and 174:
THE BUDGET FOR FISCAL YEAR 1998, HI
- Page 175 and 176:
THE BUDGET FOR FISCAL YEAR 1998, HI
- Page 177 and 178:
THE BUDGET FOR FISCAL YEAR 1998, HI
- Page 179 and 180:
THE BUDGET FOR FISCAL YEAR 1998, HI
- Page 181 and 182:
THE BUDGET FOR FISCAL YEAR 1998, HI
- Page 183 and 184:
THE BUDGET FOR FISCAL YEAR 1998, HI
- Page 185 and 186:
THE BUDGET FOR FISCAL YEAR 1998, HI
- Page 187 and 188:
THE BUDGET FOR FISCAL YEAR 1998, HI
- Page 189 and 190:
THE BUDGET FOR FISCAL YEAR 1998, HI
- Page 191 and 192:
THE BUDGET FOR FISCAL YEAR 1998, HI
- Page 193 and 194:
THE BUDGET FOR FISCAL YEAR 1998, HI
- Page 195 and 196:
THE BUDGET FOR FISCAL YEAR 1998, HI
- Page 197 and 198:
THE BUDGET FOR FISCAL YEAR 1998, HI
- Page 199 and 200:
THE BUDGET FOR FISCAL YEAR 1998, HI
- Page 201 and 202:
THE BUDGET FOR FISCAL YEAR 1998, HI
- Page 203 and 204:
THE BUDGET FOR FISCAL YEAR 1998, HI
- Page 205 and 206:
THE BUDGET FOR FISCAL YEAR 1998, HI
- Page 207 and 208:
THE BUDGET FOR FISCAL YEAR 1998, HI
- Page 209 and 210:
THE BUDGET FOR FISCAL YEAR 1998, HI
- Page 211 and 212:
THE BUDGET FOR FISCAL YEAR 1998, HI
- Page 213 and 214:
THE BUDGET FOR FISCAL YEAR 1998, HI
- Page 215 and 216:
THE BUDGET FOR FISCAL YEAR 1998, HI
- Page 217 and 218:
THE BUDGET FOR FISCAL YEAR 1998, HI
- Page 219 and 220:
THE BUDGET FOR FISCAL YEAR 1998, HI
- Page 221 and 222:
THE BUDGET FOR FISCAL YEAR 1998, HI
- Page 223 and 224:
THE BUDGET FOR FISCAL YEAR 1998, HI
- Page 225 and 226:
THE BUDGET FOR FISCAL YEAR 1998, HI
- Page 227 and 228:
THE BUDGET FOR FISCAL YEAR 1998, HI
- Page 229 and 230:
THE BUDGET FOR FISCAL YEAR 1998, HI
- Page 231 and 232:
THE BUDGET FOR FISCAL YEAR 1998, HI
- Page 233 and 234:
THE BUDGET FOR FISCAL YEAR 1998, HI
- Page 235 and 236:
THE BUDGET FOR FISCAL YEAR 1998, HI
- Page 237 and 238:
THE BUDGET FOR FISCAL YEAR 1998, HI
- Page 239 and 240:
THE BUDGET FOR FISCAL YEAR 1998, HI
- Page 241 and 242:
THE BUDGET FOR FISCAL YEAR 1998, HI
- Page 243 and 244:
THE BUDGET FOR FISCAL YEAR 1998, HI
- Page 245 and 246:
THE BUDGET FOR FISCAL YEAR 1998, HI
- Page 247 and 248:
THE BUDGET FOR FISCAL YEAR 1998, HI
- Page 249 and 250:
THE BUDGET FOR FISCAL YEAR 1998, HI
- Page 251 and 252:
THE BUDGET FOR FISCAL YEAR 1998, HI
- Page 253 and 254:
THE BUDGET FOR FISCAL YEAR 1998, HI
- Page 255 and 256:
THE BUDGET FOR FISCAL YEAR 1998, HI
- Page 257 and 258:
THE BUDGET FOR FISCAL YEAR 1998, HI
- Page 259 and 260:
THE BUDGET FOR FISCAL YEAR 1998, HI
- Page 261 and 262:
THE BUDGET FOR FISCAL YEAR 1998, HI
- Page 263 and 264:
THE BUDGET FOR FISCAL YEAR 1998, HI
- Page 265 and 266:
THE BUDGET FOR FISCAL YEAR 1998, HI
- Page 267 and 268:
THE BUDGET FOR FISCAL YEAR 1998, HI
- Page 269 and 270:
THE BUDGET FOR FISCAL YEAR 1998, HI
- Page 271 and 272:
THE BUDGET FOR FISCAL YEAR 1998, HI
- Page 273 and 274:
THE BUDGET FOR FISCAL YEAR 1998, HI
- Page 275 and 276:
THE BUDGET FOR FISCAL YEAR 1998, HI
- Page 277:
THE BUDGET FOR FISCAL YEAR 1998, HI