EOP Historical Tables of the U.S. Budget - Social Sciences Division
EOP Historical Tables of the U.S. Budget - Social Sciences Division
EOP Historical Tables of the U.S. Budget - Social Sciences Division
You also want an ePaper? Increase the reach of your titles
YUMPU automatically turns print PDFs into web optimized ePapers that Google loves.
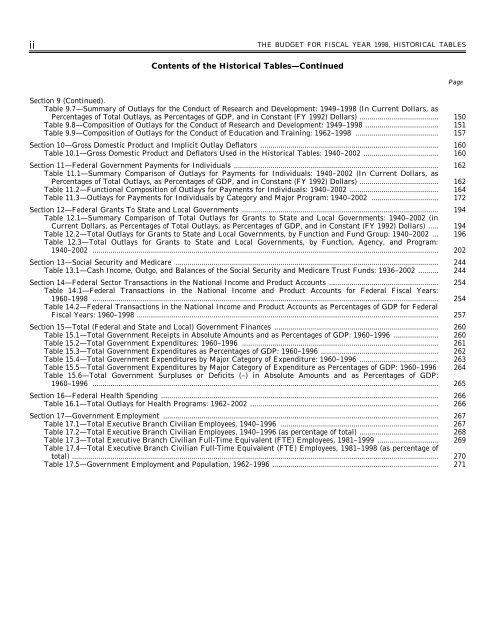
ii<br />
THE BUDGET FOR FISCAL YEAR 1998, HISTORICAL TABLES<br />
Contents <strong>of</strong> <strong>the</strong> <strong>Historical</strong> <strong>Tables</strong>—Continued<br />
Page<br />
Section 9 (Continued).<br />
Table 9.7—Summary <strong>of</strong> Outlays for <strong>the</strong> Conduct <strong>of</strong> Research and Development: 1949–1998 (In Current Dollars, as<br />
Percentages <strong>of</strong> Total Outlays, as Percentages <strong>of</strong> GDP, and in Constant (FY 1992) Dollars) ....................................... 150<br />
Table 9.8—Composition <strong>of</strong> Outlays for <strong>the</strong> Conduct <strong>of</strong> Research and Development: 1949–1998 .................................... 151<br />
Table 9.9—Composition <strong>of</strong> Outlays for <strong>the</strong> Conduct <strong>of</strong> Education and Training: 1962–1998 ......................................... 157<br />
Section 10—Gross Domestic Product and Implicit Outlay Deflators ........................................................................................ 160<br />
Table 10.1—Gross Domestic Product and Deflators Used in <strong>the</strong> <strong>Historical</strong> <strong>Tables</strong>: 1940–2002 ..................................... 160<br />
Section 11—Federal Government Payments for Individuals ..................................................................................................... 162<br />
Table 11.1—Summary Comparison <strong>of</strong> Outlays for Payments for Individuals: 1940–2002 (In Current Dollars, as<br />
Percentages <strong>of</strong> Total Outlays, as Percentages <strong>of</strong> GDP, and in Constant (FY 1992) Dollars) ....................................... 162<br />
Table 11.2—Functional Composition <strong>of</strong> Outlays for Payments for Individuals: 1940–2002 ............................................ 164<br />
Table 11.3—Outlays for Payments for Individuals by Category and Major Program: 1940–2002 ................................. 172<br />
Section 12—Federal Grants To State and Local Governments ................................................................................................. 194<br />
Table 12.1—Summary Comparison <strong>of</strong> Total Outlays for Grants to State and Local Governments: 1940–2002 (in<br />
Current Dollars, as Percentages <strong>of</strong> Total Outlays, as Percentages <strong>of</strong> GDP, and in Constant (FY 1992) Dollars) ..... 194<br />
Table 12.2—Total Outlays for Grants to State and Local Governments, by Function and Fund Group: 1940–2002 ... 196<br />
Table 12.3—Total Outlays for Grants to State and Local Governments, by Function, Agency, and Program:<br />
1940–2002 ........................................................................................................................................................................... 202<br />
Section 13—<strong>Social</strong> Security and Medicare .................................................................................................................................. 244<br />
Table 13.1—Cash Income, Outgo, and Balances <strong>of</strong> <strong>the</strong> <strong>Social</strong> Security and Medicare Trust Funds: 1936–2002 .......... 244<br />
Section 14—Federal Sector Transactions in <strong>the</strong> National Income and Product Accounts ...................................................... 254<br />
Table 14.1—Federal Transactions in <strong>the</strong> National Income and Product Accounts for Federal Fiscal Years:<br />
1960–1998 ........................................................................................................................................................................... 254<br />
Table 14.2—Federal Transactions in <strong>the</strong> National Income and Product Accounts as Percentages <strong>of</strong> GDP for Federal<br />
Fiscal Years: 1960–1998 ..................................................................................................................................................... 257<br />
Section 15—Total (Federal and State and Local) Government Finances ................................................................................. 260<br />
Table 15.1—Total Government Receipts in Absolute Amounts and as Percentages <strong>of</strong> GDP: 1960–1996 ...................... 260<br />
Table 15.2—Total Government Expenditures: 1960–1996 ................................................................................................. 261<br />
Table 15.3—Total Government Expenditures as Percentages <strong>of</strong> GDP: 1960–1996 .......................................................... 262<br />
Table 15.4—Total Government Expenditures by Major Category <strong>of</strong> Expenditure: 1960–1996 ....................................... 263<br />
Table 15.5—Total Government Expenditures by Major Category <strong>of</strong> Expenditure as Percentages <strong>of</strong> GDP: 1960–1996 264<br />
Table 15.6—Total Government Surpluses or Deficits (–) in Absolute Amounts and as Percentages <strong>of</strong> GDP:<br />
1960–1996 ........................................................................................................................................................................... 265<br />
Section 16—Federal Health Spending ......................................................................................................................................... 266<br />
Table 16.1—Total Outlays for Health Programs: 1962–2002 ............................................................................................. 266<br />
Section 17—Government Employment ........................................................................................................................................ 267<br />
Table 17.1—Total Executive Branch Civilian Employees, 1940–1996 .............................................................................. 267<br />
Table 17.2—Total Executive Branch Civilian Employees, 1940–1996 (as percentage <strong>of</strong> total) ....................................... 268<br />
Table 17.3—Total Executive Branch Civilian Full-Time Equivalent (FTE) Employees, 1981–1999 .............................. 269<br />
Table 17.4—Total Executive Branch Civilian Full-Time Equivalent (FTE) Employees, 1981–1998 (as percentage <strong>of</strong><br />
total) ..................................................................................................................................................................................... 270<br />
Table 17.5—Government Employment and Population, 1962–1996 .................................................................................. 271


