EOP Historical Tables of the U.S. Budget - Social Sciences Division
EOP Historical Tables of the U.S. Budget - Social Sciences Division
EOP Historical Tables of the U.S. Budget - Social Sciences Division

You also want an ePaper? Increase the reach of your titles
YUMPU automatically turns print PDFs into web optimized ePapers that Google loves.
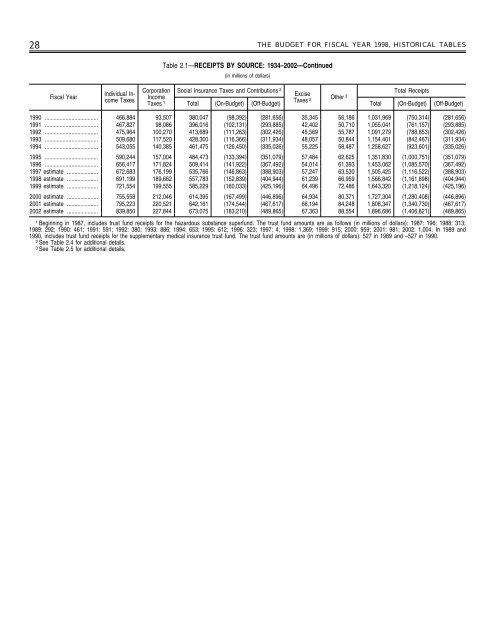
28 THE BUDGET FOR FISCAL YEAR 1998, HISTORICAL TABLES<br />
Table 2.1—RECEIPTS BY SOURCE: 1934–2002—Continued<br />
(in millions <strong>of</strong> dollars)<br />
Fiscal Year<br />
Individual Income<br />
Taxes<br />
Corporation <strong>Social</strong> Insurance Taxes and Contributions 2<br />
Income<br />
Excise<br />
Total Receipts<br />
Taxes 1 Taxes 2 O<strong>the</strong>r 3<br />
Total (On-<strong>Budget</strong>) (Off-<strong>Budget</strong>) Total (On-<strong>Budget</strong>) (Off-<strong>Budget</strong>)<br />
1990 .................................... 466,884 93,507 380,047 (98,392) (281,656) 35,345 56,186 1,031,969 (750,314) (281,656)<br />
1991 .................................... 467,827 98,086 396,016 (102,131) (293,885) 42,402 50,710 1,055,041 (761,157) (293,885)<br />
1992 .................................... 475,964 100,270 413,689 (111,263) (302,426) 45,569 55,787 1,091,279 (788,853) (302,426)<br />
1993 .................................... 509,680 117,520 428,300 (116,366) (311,934) 48,057 50,844 1,154,401 (842,467) (311,934)<br />
1994 .................................... 543,055 140,385 461,475 (126,450) (335,026) 55,225 58,487 1,258,627 (923,601) (335,026)<br />
1995 .................................... 590,244 157,004 484,473 (133,394) (351,079) 57,484 62,625 1,351,830 (1,000,751) (351,079)<br />
1996 .................................... 656,417 171,824 509,414 (141,922) (367,492) 54,014 61,393 1,453,062 (1,085,570) (367,492)<br />
1997 estimate ..................... 672,683 176,199 535,766 (146,863) (388,903) 57,247 63,530 1,505,425 (1,116,522) (388,903)<br />
1998 estimate ..................... 691,199 189,662 557,783 (152,839) (404,944) 61,239 66,959 1,566,842 (1,161,898) (404,944)<br />
1999 estimate ..................... 721,554 199,555 585,229 (160,033) (425,196) 64,496 72,486 1,643,320 (1,218,124) (425,196)<br />
2000 estimate ..................... 755,558 212,046 614,395 (167,499) (446,896) 64,934 80,371 1,727,304 (1,280,408) (446,896)<br />
2001 estimate ..................... 795,223 220,521 642,161 (174,544) (467,617) 66,194 84,248 1,808,347 (1,340,730) (467,617)<br />
2002 estimate ..................... 839,850 227,844 673,075 (183,210) (489,865) 67,363 88,554 1,896,686 (1,406,821) (489,865)<br />
1 Beginning in 1987, includes trust fund receipts for <strong>the</strong> hazardous substance superfund. The trust fund amounts are as follows (in millions <strong>of</strong> dollars): 1987: 196; 1988: 313;<br />
1989: 292; 1990: 461; 1991: 591; 1992: 380; 1993: 886; 1994: 653; 1995: 612; 1996: 323; 1997: 4; 1998: 1,369; 1999: 915; 2000: 959; 2001: 981; 2002: 1,004. In 1989 and<br />
1990, includes trust fund receipts for <strong>the</strong> supplementary medical insurance trust fund. The trust fund amounts are (in millions <strong>of</strong> dollars): 527 in 1989 and –527 in 1990.<br />
2 See Table 2.4 for additional details.<br />
3 See Table 2.5 for additional details.