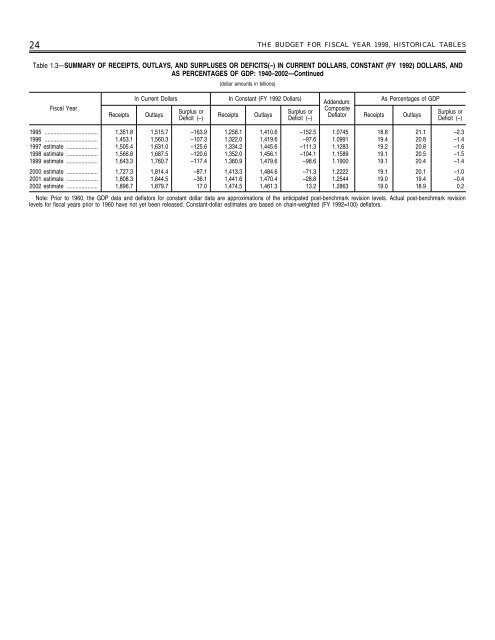
24 THE BUDGET FOR FISCAL YEAR 1998, HISTORICAL TABLES Table 1.3—SUMMARY OF RECEIPTS, OUTLAYS, AND SURPLUSES OR DEFICITS(–) IN CURRENT DOLLARS, CONSTANT (FY 1992) DOLLARS, AND AS PERCENTAGES OF GDP: 1940–2002—Continued (dollar amounts in billions) Fiscal Year Receipts In Current Dollars Outlays Surplus or Deficit (–) Receipts In Constant (FY 1992 Dollars) Outlays Surplus or Deficit (–) Addendum: Composite Deflator Receipts As Percentages <strong>of</strong> GDP Outlays Surplus or Deficit (–) 1995 .................................... 1,351.8 1,515.7 –163.9 1,258.1 1,410.6 –152.5 1.0745 18.8 21.1 –2.3 1996 .................................... 1,453.1 1,560.3 –107.3 1,322.0 1,419.6 –97.6 1.0991 19.4 20.8 –1.4 1997 estimate ..................... 1,505.4 1,631.0 –125.6 1,334.2 1,445.6 –111.3 1.1283 19.2 20.8 –1.6 1998 estimate ..................... 1,566.8 1,687.5 –120.6 1,352.0 1,456.1 –104.1 1.1589 19.1 20.5 –1.5 1999 estimate ..................... 1,643.3 1,760.7 –117.4 1,380.9 1,479.6 –98.6 1.1900 19.1 20.4 –1.4 2000 estimate ..................... 1,727.3 1,814.4 –87.1 1,413.3 1,484.6 –71.3 1.2222 19.1 20.1 –1.0 2001 estimate ..................... 1,808.3 1,844.5 –36.1 1,441.6 1,470.4 –28.8 1.2544 19.0 19.4 –0.4 2002 estimate ..................... 1,896.7 1,879.7 17.0 1,474.5 1,461.3 13.2 1.2863 19.0 18.9 0.2 Note: Prior to 1960, <strong>the</strong> GDP data and deflators for constant dollar data are approximations <strong>of</strong> <strong>the</strong> anticipated post-benchmark revision levels. Actual post-benchmark revision levels for fiscal years prior to 1960 have not yet been released. Constant-dollar estimates are based on chain-weighted (FY 1992=100) deflators.
THE BUDGET FOR FISCAL YEAR 1998, HISTORICAL TABLES 25 Table 1.4—RECEIPTS, OUTLAYS, AND SURPLUSES OR DEFICITS(–) BY FUND GROUP: 1934–2002 (in millions <strong>of</strong> dollars) Receipts Outlays Surplus or Deficit (–) Fiscal Year Total Federal Funds Trust Funds Interfund Transactions Total Federal Funds Trust Funds Interfund Transactions Total Federal Funds Trust Funds 1934 ....................................................................... 2,955 2,926 72 –42 6,541 6,558 25 –42 –3,586 –3,633 47 1935 ....................................................................... 3,609 3,578 76 –45 6,412 6,427 30 –45 –2,803 –2,849 46 1936 ....................................................................... 3,923 3,871 168 –116 8,228 8,335 9 –116 –4,304 –4,464 159 1937 ....................................................................... 5,387 4,794 691 –99 7,580 7,620 58 –99 –2,193 –2,826 633 1938 ....................................................................... 6,751 5,477 1,474 –201 6,840 6,689 351 –201 –89 –1,212 1,124 1939 ....................................................................... 6,295 4,822 1,657 –184 9,141 8,718 607 –184 –2,846 –3,896 1,051 1940 ....................................................................... 6,548 4,929 1,845 –225 9,468 8,974 720 –225 –2,920 –4,045 1,125 1941 ....................................................................... 8,712 6,900 2,090 –277 13,653 13,260 671 –277 –4,941 –6,360 1,419 1942 ....................................................................... 14,634 12,336 2,613 –315 35,137 34,831 620 –315 –20,503 –22,496 1,992 1943 ....................................................................... 24,001 21,117 3,279 –395 78,555 78,765 185 –395 –54,554 –57,648 3,094 1944 ....................................................................... 43,747 40,466 3,896 –615 91,304 92,284 –365 –615 –47,557 –51,818 4,261 1945 ....................................................................... 45,159 41,875 5,045 –1,760 92,712 94,846 –374 –1,760 –47,553 –52,972 5,419 1946 ....................................................................... 39,296 36,357 5,144 –2,205 55,232 56,204 1,234 –2,205 –15,936 –19,847 3,910 1947 ....................................................................... 38,514 35,380 4,885 –1,751 34,496 34,803 1,444 –1,751 4,018 577 3,441 1948 ....................................................................... 41,560 37,822 4,894 –1,156 29,764 28,988 1,932 –1,156 11,796 8,834 2,962 1949 ....................................................................... 39,415 35,849 4,750 –1,184 38,835 37,686 2,333 –1,184 580 –1,838 2,417 1950 ....................................................................... 39,443 35,334 5,823 –1,715 42,562 38,389 5,888 –1,715 –3,119 –3,055 –65 1951 ....................................................................... 51,616 46,183 6,729 –1,296 45,514 43,732 3,078 –1,296 6,102 2,451 3,651 1952 ....................................................................... 66,167 59,989 7,744 –1,566 67,686 64,994 4,257 –1,566 –1,519 –5,005 3,486 1953 ....................................................................... 69,608 63,085 8,080 –1,557 76,101 73,006 4,652 –1,557 –6,493 –9,921 3,427 1954 ....................................................................... 69,701 62,774 8,297 –1,370 70,855 65,924 6,301 –1,370 –1,154 –3,151 1,997 1955 ....................................................................... 65,451 58,168 8,627 –1,344 68,444 62,341 7,447 –1,344 –2,993 –4,173 1,180 1956 ....................................................................... 74,587 65,594 10,745 –1,753 70,640 64,281 8,111 –1,753 3,947 1,313 2,634 1957 ....................................................................... 79,990 68,847 13,210 –2,067 76,578 67,189 11,456 –2,067 3,412 1,657 1,755 1958 ....................................................................... 79,636 66,720 15,082 –2,166 82,405 69,737 14,834 –2,166 –2,769 –3,017 248 1959 ....................................................................... 79,249 65,800 15,770 –2,321 92,098 77,071 17,348 –2,321 –12,849 –11,271 –1,578 1960 ....................................................................... 92,492 75,647 19,232 –2,387 92,191 74,856 19,722 –2,387 301 791 –490 1961 ....................................................................... 94,388 75,175 22,320 –3,107 97,723 79,368 21,462 –3,107 –3,335 –4,193 858 1962 ....................................................................... 99,676 79,700 22,981 –3,005 106,821 86,546 23,281 –3,005 –7,146 –6,847 –299 1963 ....................................................................... 106,560 84,013 25,792 –3,245 111,316 90,643 23,918 –3,245 –4,756 –6,630 1,874 1964 ....................................................................... 112,613 87,511 28,461 –3,358 118,528 96,098 25,788 –3,358 –5,915 –8,588 2,673 1965 ....................................................................... 116,817 90,943 29,202 –3,328 118,228 94,853 26,703 –3,328 –1,411 –3,910 2,499 1966 ....................................................................... 130,835 101,428 32,959 –3,552 134,532 106,590 31,495 –3,552 –3,698 –5,162 1,464 1967 ....................................................................... 148,822 111,835 42,213 –5,227 157,464 127,544 35,147 –5,227 –8,643 –15,709 7,066 1968 ....................................................................... 152,973 114,726 44,011 –5,764 178,134 143,100 40,799 –5,764 –25,161 –28,373 3,212 1969 ....................................................................... 186,882 143,322 51,108 –7,549 183,640 148,192 42,996 –7,549 3,242 –4,871 8,112 1970 ....................................................................... 192,807 143,159 58,425 –8,777 195,649 156,327 48,099 –8,777 –2,842 –13,168 10,326 1971 ....................................................................... 187,139 133,785 64,937 –11,583 210,172 163,681 58,074 –11,583 –23,033 –29,896 6,863 1972 ....................................................................... 207,309 148,846 71,619 –13,156 230,681 178,144 65,693 –13,156 –23,373 –29,299 5,926 1973 ....................................................................... 230,799 161,357 90,767 –21,325 245,707 187,044 79,988 –21,325 –14,908 –25,687 10,779 1974 ....................................................................... 263,224 181,228 103,789 –21,793 269,359 201,376 89,776 –21,793 –6,135 –20,148 14,013 1975 ....................................................................... 279,090 187,505 117,647 –26,061 332,332 248,174 110,220 –26,061 –53,242 –60,669 7,427 1976 ....................................................................... 298,060 201,099 132,509 –35,548 371,792 277,242 130,099 –35,548 –73,732 –76,143 2,410 TQ .......................................................................... 81,232 54,085 31,625 –4,478 95,975 66,878 33,575 –4,478 –14,744 –12,794 –1,950 1977 ....................................................................... 355,559 241,312 151,503 –37,256 409,218 304,474 142,000 –37,256 –53,659 –63,162 9,502 1978 ....................................................................... 399,561 270,490 166,468 –37,397 458,746 342,372 153,771 –37,397 –59,186 –71,882 12,697 1979 ....................................................................... 463,302 316,366 188,072 –41,136 504,032 375,435 169,733 –41,136 –40,729 –59,069 18,339 1980 ....................................................................... 517,112 350,856 212,106 –45,850 590,947 433,494 203,302 –45,850 –73,835 –82,639 8,804 1981 ....................................................................... 599,272 410,422 240,601 –51,751 678,249 496,222 233,778 –51,751 –78,976 –85,799 6,823 1982 ....................................................................... 617,766 409,253 270,138 –61,625 745,755 543,486 263,894 –61,625 –127,989 –134,233 6,244 1983 ....................................................................... 600,562 382,432 319,363 –101,233 808,380 613,331 296,282 –101,233 –207,818 –230,899 23,081 1984 ....................................................................... 666,499 420,412 338,661 –92,574 851,888 638,705 305,757 –92,574 –185,388 –218,293 32,905 1985 ....................................................................... 734,165 460,388 397,500 –123,723 946,499 726,871 343,351 –123,723 –212,334 –266,483 54,149 1986 ....................................................................... 769,260 474,170 423,377 –128,287 990,505 757,308 361,484 –128,287 –221,245 –283,138 61,893 1987 ....................................................................... 854,396 538,752 444,203 –128,559 1,004,164 761,138 371,585 –128,559 –149,769 –222,387 72,618 1988 ....................................................................... 909,303 561,447 491,202 –143,346 1,064,489 814,358 393,478 –143,346 –155,187 –252,910 97,724 1989 ....................................................................... 991,190 615,322 535,941 –160,073 1,143,671 891,286 412,458 –160,073 –152,481 –275,964 123,483 See note at end <strong>of</strong> table.
- Page 1 and 2: HISTORICAL TABLES BUDGET OF THE UNI
- Page 3 and 4: Contents of the Historical Tables P
- Page 5 and 6: INTRODUCTION STRUCTURE, COVERAGE AN
- Page 7 and 8: THE BUDGET FOR FISCAL YEAR 1998, HI
- Page 9 and 10: SECTION NOTES Notes on Section 1 (O
- Page 11 and 12: THE BUDGET FOR FISCAL YEAR 1998, HI
- Page 13 and 14: THE BUDGET FOR FISCAL YEAR 1998, HI
- Page 15 and 16: THE BUDGET FOR FISCAL YEAR 1998, HI
- Page 17: THE BUDGET FOR FISCAL YEAR 1998, HI
- Page 20 and 21: 16 THE BUDGET FOR FISCAL YEAR 1998,
- Page 22: 18 THE BUDGET FOR FISCAL YEAR 1998,
- Page 25 and 26: THE BUDGET FOR FISCAL YEAR 1998, HI
- Page 27 and 28: THE BUDGET FOR FISCAL YEAR 1998, HI
- Page 29: THE BUDGET FOR FISCAL YEAR 1998, HI
- Page 33 and 34: THE BUDGET FOR FISCAL YEAR 1998, HI
- Page 35 and 36: THE BUDGET FOR FISCAL YEAR 1998, HI
- Page 37 and 38: THE BUDGET FOR FISCAL YEAR 1998, HI
- Page 39 and 40: THE BUDGET FOR FISCAL YEAR 1998, HI
- Page 41 and 42: THE BUDGET FOR FISCAL YEAR 1998, HI
- Page 43 and 44: THE BUDGET FOR FISCAL YEAR 1998, HI
- Page 45 and 46: THE BUDGET FOR FISCAL YEAR 1998, HI
- Page 47 and 48: THE BUDGET FOR FISCAL YEAR 1998, HI
- Page 49 and 50: THE BUDGET FOR FISCAL YEAR 1998, HI
- Page 51 and 52: THE BUDGET FOR FISCAL YEAR 1998, HI
- Page 53 and 54: THE BUDGET FOR FISCAL YEAR 1998, HI
- Page 55 and 56: THE BUDGET FOR FISCAL YEAR 1998, HI
- Page 57 and 58: THE BUDGET FOR FISCAL YEAR 1998, HI
- Page 59 and 60: THE BUDGET FOR FISCAL YEAR 1998, HI
- Page 61 and 62: THE BUDGET FOR FISCAL YEAR 1998, HI
- Page 63 and 64: THE BUDGET FOR FISCAL YEAR 1998, HI
- Page 65 and 66: THE BUDGET FOR FISCAL YEAR 1998, HI
- Page 67 and 68: THE BUDGET FOR FISCAL YEAR 1998, HI
- Page 69 and 70: THE BUDGET FOR FISCAL YEAR 1998, HI
- Page 71 and 72: THE BUDGET FOR FISCAL YEAR 1998, HI
- Page 73 and 74: THE BUDGET FOR FISCAL YEAR 1998, HI
- Page 75 and 76: THE BUDGET FOR FISCAL YEAR 1998, HI
- Page 77 and 78: THE BUDGET FOR FISCAL YEAR 1998, HI
- Page 79 and 80: THE BUDGET FOR FISCAL YEAR 1998, HI
- Page 81 and 82:
THE BUDGET FOR FISCAL YEAR 1998, HI
- Page 83 and 84:
THE BUDGET FOR FISCAL YEAR 1998, HI
- Page 85 and 86:
THE BUDGET FOR FISCAL YEAR 1998, HI
- Page 87 and 88:
THE BUDGET FOR FISCAL YEAR 1998, HI
- Page 89 and 90:
THE BUDGET FOR FISCAL YEAR 1998, HI
- Page 91 and 92:
THE BUDGET FOR FISCAL YEAR 1998, HI
- Page 93 and 94:
THE BUDGET FOR FISCAL YEAR 1998, HI
- Page 95 and 96:
THE BUDGET FOR FISCAL YEAR 1998, HI
- Page 97 and 98:
THE BUDGET FOR FISCAL YEAR 1998, HI
- Page 99 and 100:
THE BUDGET FOR FISCAL YEAR 1998, HI
- Page 101 and 102:
THE BUDGET FOR FISCAL YEAR 1998, HI
- Page 103 and 104:
THE BUDGET FOR FISCAL YEAR 1998, HI
- Page 105 and 106:
THE BUDGET FOR FISCAL YEAR 1998, HI
- Page 107 and 108:
THE BUDGET FOR FISCAL YEAR 1998, HI
- Page 109 and 110:
THE BUDGET FOR FISCAL YEAR 1998, HI
- Page 111 and 112:
THE BUDGET FOR FISCAL YEAR 1998, HI
- Page 113 and 114:
THE BUDGET FOR FISCAL YEAR 1998, HI
- Page 115 and 116:
THE BUDGET FOR FISCAL YEAR 1998, HI
- Page 117 and 118:
THE BUDGET FOR FISCAL YEAR 1998, HI
- Page 119 and 120:
THE BUDGET FOR FISCAL YEAR 1998, HI
- Page 121 and 122:
THE BUDGET FOR FISCAL YEAR 1998, HI
- Page 123 and 124:
THE BUDGET FOR FISCAL YEAR 1998, HI
- Page 125 and 126:
THE BUDGET FOR FISCAL YEAR 1998, HI
- Page 127 and 128:
THE BUDGET FOR FISCAL YEAR 1998, HI
- Page 129 and 130:
THE BUDGET FOR FISCAL YEAR 1998, HI
- Page 131 and 132:
THE BUDGET FOR FISCAL YEAR 1998, HI
- Page 133 and 134:
THE BUDGET FOR FISCAL YEAR 1998, HI
- Page 135 and 136:
THE BUDGET FOR FISCAL YEAR 1998, HI
- Page 137 and 138:
THE BUDGET FOR FISCAL YEAR 1998, HI
- Page 139 and 140:
THE BUDGET FOR FISCAL YEAR 1998, HI
- Page 141 and 142:
THE BUDGET FOR FISCAL YEAR 1998, HI
- Page 143 and 144:
THE BUDGET FOR FISCAL YEAR 1998, HI
- Page 145 and 146:
THE BUDGET FOR FISCAL YEAR 1998, HI
- Page 147 and 148:
THE BUDGET FOR FISCAL YEAR 1998, HI
- Page 149 and 150:
THE BUDGET FOR FISCAL YEAR 1998, HI
- Page 151 and 152:
THE BUDGET FOR FISCAL YEAR 1998, HI
- Page 153 and 154:
THE BUDGET FOR FISCAL YEAR 1998, HI
- Page 155 and 156:
THE BUDGET FOR FISCAL YEAR 1998, HI
- Page 157 and 158:
THE BUDGET FOR FISCAL YEAR 1998, HI
- Page 159 and 160:
THE BUDGET FOR FISCAL YEAR 1998, HI
- Page 161 and 162:
THE BUDGET FOR FISCAL YEAR 1998, HI
- Page 163 and 164:
THE BUDGET FOR FISCAL YEAR 1998, HI
- Page 165 and 166:
THE BUDGET FOR FISCAL YEAR 1998, HI
- Page 167 and 168:
THE BUDGET FOR FISCAL YEAR 1998, HI
- Page 169 and 170:
THE BUDGET FOR FISCAL YEAR 1998, HI
- Page 171 and 172:
THE BUDGET FOR FISCAL YEAR 1998, HI
- Page 173 and 174:
THE BUDGET FOR FISCAL YEAR 1998, HI
- Page 175 and 176:
THE BUDGET FOR FISCAL YEAR 1998, HI
- Page 177 and 178:
THE BUDGET FOR FISCAL YEAR 1998, HI
- Page 179 and 180:
THE BUDGET FOR FISCAL YEAR 1998, HI
- Page 181 and 182:
THE BUDGET FOR FISCAL YEAR 1998, HI
- Page 183 and 184:
THE BUDGET FOR FISCAL YEAR 1998, HI
- Page 185 and 186:
THE BUDGET FOR FISCAL YEAR 1998, HI
- Page 187 and 188:
THE BUDGET FOR FISCAL YEAR 1998, HI
- Page 189 and 190:
THE BUDGET FOR FISCAL YEAR 1998, HI
- Page 191 and 192:
THE BUDGET FOR FISCAL YEAR 1998, HI
- Page 193 and 194:
THE BUDGET FOR FISCAL YEAR 1998, HI
- Page 195 and 196:
THE BUDGET FOR FISCAL YEAR 1998, HI
- Page 197 and 198:
THE BUDGET FOR FISCAL YEAR 1998, HI
- Page 199 and 200:
THE BUDGET FOR FISCAL YEAR 1998, HI
- Page 201 and 202:
THE BUDGET FOR FISCAL YEAR 1998, HI
- Page 203 and 204:
THE BUDGET FOR FISCAL YEAR 1998, HI
- Page 205 and 206:
THE BUDGET FOR FISCAL YEAR 1998, HI
- Page 207 and 208:
THE BUDGET FOR FISCAL YEAR 1998, HI
- Page 209 and 210:
THE BUDGET FOR FISCAL YEAR 1998, HI
- Page 211 and 212:
THE BUDGET FOR FISCAL YEAR 1998, HI
- Page 213 and 214:
THE BUDGET FOR FISCAL YEAR 1998, HI
- Page 215 and 216:
THE BUDGET FOR FISCAL YEAR 1998, HI
- Page 217 and 218:
THE BUDGET FOR FISCAL YEAR 1998, HI
- Page 219 and 220:
THE BUDGET FOR FISCAL YEAR 1998, HI
- Page 221 and 222:
THE BUDGET FOR FISCAL YEAR 1998, HI
- Page 223 and 224:
THE BUDGET FOR FISCAL YEAR 1998, HI
- Page 225 and 226:
THE BUDGET FOR FISCAL YEAR 1998, HI
- Page 227 and 228:
THE BUDGET FOR FISCAL YEAR 1998, HI
- Page 229 and 230:
THE BUDGET FOR FISCAL YEAR 1998, HI
- Page 231 and 232:
THE BUDGET FOR FISCAL YEAR 1998, HI
- Page 233 and 234:
THE BUDGET FOR FISCAL YEAR 1998, HI
- Page 235 and 236:
THE BUDGET FOR FISCAL YEAR 1998, HI
- Page 237 and 238:
THE BUDGET FOR FISCAL YEAR 1998, HI
- Page 239 and 240:
THE BUDGET FOR FISCAL YEAR 1998, HI
- Page 241 and 242:
THE BUDGET FOR FISCAL YEAR 1998, HI
- Page 243 and 244:
THE BUDGET FOR FISCAL YEAR 1998, HI
- Page 245 and 246:
THE BUDGET FOR FISCAL YEAR 1998, HI
- Page 247 and 248:
THE BUDGET FOR FISCAL YEAR 1998, HI
- Page 249 and 250:
THE BUDGET FOR FISCAL YEAR 1998, HI
- Page 251 and 252:
THE BUDGET FOR FISCAL YEAR 1998, HI
- Page 253 and 254:
THE BUDGET FOR FISCAL YEAR 1998, HI
- Page 255 and 256:
THE BUDGET FOR FISCAL YEAR 1998, HI
- Page 257 and 258:
THE BUDGET FOR FISCAL YEAR 1998, HI
- Page 259 and 260:
THE BUDGET FOR FISCAL YEAR 1998, HI
- Page 261 and 262:
THE BUDGET FOR FISCAL YEAR 1998, HI
- Page 263 and 264:
THE BUDGET FOR FISCAL YEAR 1998, HI
- Page 265 and 266:
THE BUDGET FOR FISCAL YEAR 1998, HI
- Page 267 and 268:
THE BUDGET FOR FISCAL YEAR 1998, HI
- Page 269 and 270:
THE BUDGET FOR FISCAL YEAR 1998, HI
- Page 271 and 272:
THE BUDGET FOR FISCAL YEAR 1998, HI
- Page 273 and 274:
THE BUDGET FOR FISCAL YEAR 1998, HI
- Page 275 and 276:
THE BUDGET FOR FISCAL YEAR 1998, HI
- Page 277:
THE BUDGET FOR FISCAL YEAR 1998, HI