Aerodynamic Stability and Performance of Next-Generation ...
Aerodynamic Stability and Performance of Next-Generation ...
Aerodynamic Stability and Performance of Next-Generation ...

You also want an ePaper? Increase the reach of your titles
YUMPU automatically turns print PDFs into web optimized ePapers that Google loves.
Downloaded by GEORGIA INST OF TECHNOLOGY on April 1, 2013 | http://arc.aiaa.org | DOI: 10.2514/6.2013-1356<br />
potentially introduce a large, violent moment on the payload<br />
if it were suddenly displaced from the trim total angle <strong>of</strong><br />
attack due to a gust <strong>of</strong> wind or other perturbation. Another<br />
important feature <strong>of</strong> the curve is the peak C m value. Higher<br />
peak values could also potentially cause violent motion <strong>and</strong><br />
could cause destabilizing system dynamics. Therefore, a<br />
lower overall C m curve is considered to be beneficial.<br />
Figure 10 shows a plot <strong>of</strong> the pitch damping curve for the<br />
RS-1 canopy. In this case, the pitch damping coefficient at<br />
the trim total angle <strong>of</strong> attack is less than zero; therefore, the<br />
canopy is dynamically stable at this point. However, the<br />
curves <strong>of</strong> different canopies vary widely <strong>and</strong> there is no<br />
overall trend regarding their dynamic stability at the trim<br />
total angle <strong>of</strong> attack. To obtain a smooth curve it was<br />
necessary to increase the bin size to 1.5°. However, the<br />
coefficients values still scatter towards lower total angles <strong>of</strong><br />
attack. As a result, it is difficult to determine the shape <strong>of</strong><br />
the pitch damping curve, which makes comparisons between<br />
canopies difficult.<br />
D. Comparison to Heritage Wind Tunnel Results<br />
Prior to the Mars Exploration Rover missions, wind<br />
tunnel tests <strong>of</strong> various DGB parachutes were performed in<br />
the TDT to determine their drag performance <strong>and</strong> static<br />
stability behavior. 2 Moment values for each canopy were<br />
measured by constraining the parachute in a fixture that<br />
was rotated through a range <strong>of</strong> angles <strong>of</strong> attack. The data<br />
from this test have served as the basis <strong>of</strong> the parachute<br />
aerodynamics models for all subsequent U.S. Mars<br />
missions. In addition, the success <strong>of</strong> the DGB parachutes<br />
used in these missions demonstrates that these data are<br />
representative <strong>of</strong> Mars flight conditions <strong>and</strong> are the closest<br />
aerodynamics set to true parachute motion currently<br />
available. Therefore, it is useful to compare the results <strong>of</strong><br />
the present NFAC test to the TDT test to ensure that the<br />
aerodynamics predicted by each test are not in conflict.<br />
As part <strong>of</strong> the TDT test campaign, a sub-scale version <strong>of</strong><br />
the Mars Viking DGB was flown that had a nominal<br />
diameter <strong>of</strong> approximately 5.2 ft <strong>and</strong> was constructed from<br />
Figure 10. Dynamic moment coefficients as a<br />
function <strong>of</strong> total angle <strong>of</strong> attack for the RS-1<br />
canopy.<br />
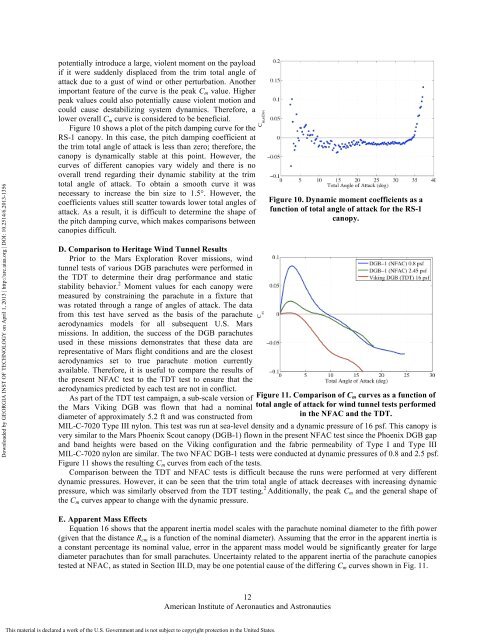
Figure 11. Comparison <strong>of</strong> C m curves as a function <strong>of</strong><br />
total angle <strong>of</strong> attack for wind tunnel tests performed<br />
in the NFAC <strong>and</strong> the TDT.<br />
MIL-C-7020 Type III nylon. This test was run at sea-level density <strong>and</strong> a dynamic pressure <strong>of</strong> 16 psf. This canopy is<br />
very similar to the Mars Phoenix Scout canopy (DGB-1) flown in the present NFAC test since the Phoenix DGB gap<br />
<strong>and</strong> b<strong>and</strong> heights were based on the Viking configuration <strong>and</strong> the fabric permeability <strong>of</strong> Type I <strong>and</strong> Type III<br />
MIL-C-7020 nylon are similar. The two NFAC DGB-1 tests were conducted at dynamic pressures <strong>of</strong> 0.8 <strong>and</strong> 2.5 psf.<br />
Figure 11 shows the resulting C m curves from each <strong>of</strong> the tests.<br />
Comparison between the TDT <strong>and</strong> NFAC tests is difficult because the runs were performed at very different<br />
dynamic pressures. However, it can be seen that the trim total angle <strong>of</strong> attack decreases with increasing dynamic<br />
pressure, which was similarly observed from the TDT testing. 2 Additionally, the peak C m <strong>and</strong> the general shape <strong>of</strong><br />
the C m curves appear to change with the dynamic pressure.<br />
E. Apparent Mass Effects<br />
Equation 16 shows that the apparent inertia model scales with the parachute nominal diameter to the fifth power<br />
(given that the distance R cm is a function <strong>of</strong> the nominal diameter). Assuming that the error in the apparent inertia is<br />
a constant percentage its nominal value, error in the apparent mass model would be significantly greater for large<br />
diameter parachutes than for small parachutes. Uncertainty related to the apparent inertia <strong>of</strong> the parachute canopies<br />
tested at NFAC, as stated in Section III.D, may be one potential cause <strong>of</strong> the differing C m curves shown in Fig. 11.<br />
12<br />
American Institute <strong>of</strong> Aeronautics <strong>and</strong> Astronautics<br />
This material is declared a work <strong>of</strong> the U.S. Government <strong>and</strong> is not subject to copyright protection in the United States.